
RedK Trader Pressure Index (TPX v1.0)
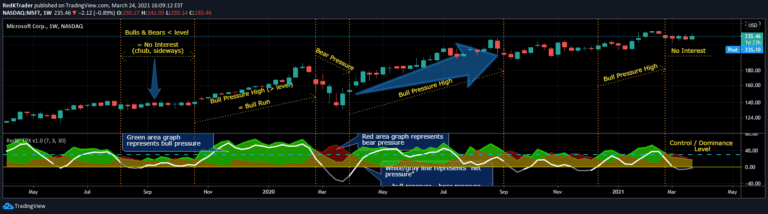
The RedK Trader Pressure Index (TPX) analyzes price bar changes to reveal the ongoing battle between bulls and bears, providing insights into market control and potential price action direction.
Explore 11,183 indicators. Filter beyond the obvious.
Discover the tools that fit the way you trade.
11,183 tools to explore
The RedK Trader Pressure Index (TPX) analyzes price bar changes to reveal the ongoing battle between bulls and bears, providing insights into market control and potential price action direction.
A sophisticated indicator tracking smart money investor activities versus less informed traders, using RSI-based ratios to identify potential market entry and exit points.
A trading tool that tracks cumulative buy and sell volumes across different time periods, providing visual insights into market participant behavior and volume dynamics.
Real-time indicator tracking trader liquidations in the market, revealing potential trend reversals and market sentiment through long and short position forced closures.
A dynamic volume analysis tool that tracks volume flow, measures trading activity intensity, and provides real-time insights into buyer and seller dominance across different timeframes.
A multi-timeframe indicator that identifies institutional order blocks and supply/demand zones, revealing potential price reversal and continuation areas using volume and directional analysis.
A polar chart tool that visualizes cryptocurrency dominance by combining traded dollar volume and volatility across multiple timeframes for easy comparative analysis.
A tool tracking the supply dominance of major stablecoins, showing their relative market share and evolution over time across different cryptocurrency markets.
Dixson's Weighted Volume Flow analyzes buy and sell volume distribution by calculating volume allocation based on price action within each trading bar.
A bank nifty indicator that tracks individual bank contributions and provides visual representation of market strength through lines showing buyer and seller dynamics.
The Simple Dominance Momentum Indicator tracks cryptocurrency market trends by analyzing dominance and market movement, helping traders visualize data from CryptoCap charts.
A comprehensive cryptocurrency market monitoring tool that tracks indices, currency pairs, and real-time market developments across multiple indicators and metrics.
Likes, views, and comments are historical TradingView snapshots. They describe attention, not trading performance.