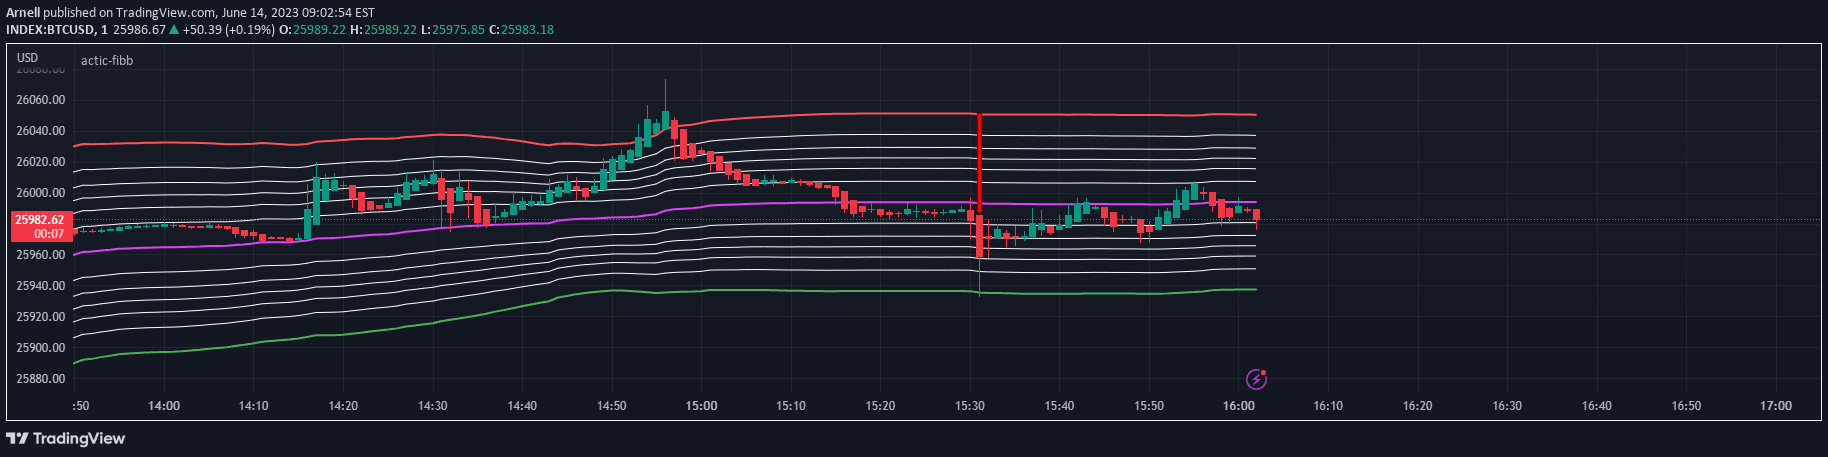
Fibonacci Bollinger Volume Weighted Deviation
A sophisticated trading indicator combining Fibonacci ratios, Bollinger Bands, and volume analysis to identify market dynamics, potential reversals, and trend strength.
Explore 11,183 indicators. Filter beyond the obvious.
Discover the tools that fit the way you trade.
11,183 tools to explore
A sophisticated trading indicator combining Fibonacci ratios, Bollinger Bands, and volume analysis to identify market dynamics, potential reversals, and trend strength.
A multi-faceted trading indicator combining trend detection, RSI momentum, and Fibonacci retracement levels to provide comprehensive market analysis and potential entry signals.
Fibo ZigZag is an advanced trading tool that combines ZigZag pattern detection with Fibonacci retracement levels to help traders analyze trend structure and identify potential price reversal zones.
A trading signal that identifies support and resistance levels using Fibonacci 0.5 levels and daily volatility to generate precise entry and exit points for trades.
A trading signal utilizing Fibonacci and Bollinger Bands with 200-day VMA crossover, generating buy and sell arrows based on trend and volatility indicators.
A trading indicator that combines Bollinger Bands with Fibonacci ratios to dynamically identify potential support and resistance zones based on market volatility and price movement.
Fibonacci Bands are dynamic support and resistance zones that adapt to market volatility using moving averages and Fibonacci ratios, helping traders identify potential entry and exit points.
Likes, views, and comments are historical TradingView snapshots. They describe attention, not trading performance.