the Flasher
A visual trading signal that uses dynamic chart background color changes to alert traders of specific market conditions. Provides instant visual feedback about potential trading opportunities or significant price movements.
Explore 11,183 indicators. Filter beyond the obvious.
Discover the tools that fit the way you trade.
11,183 tools to explore
A visual trading signal that uses dynamic chart background color changes to alert traders of specific market conditions. Provides instant visual feedback about potential trading opportunities or significant price movements.
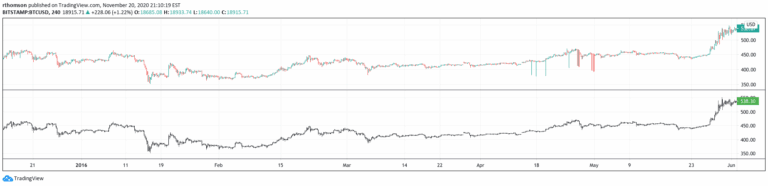
A trading signal that creates price candles using a median aggregated Bitcoin index from multiple exchanges, aiming to minimize data inconsistencies and provide more reliable price history.
A logarithmic volume indicator that calculates delta between buying and selling volume to reveal market pressure and potential flash crash conditions.
A statistical trading strategy that calculates daily price potential using bandwidth calculations and previous day's high/low price ranges to identify potential entry and exit points.
A multi-layered momentum and volatility indicator combining RSI, Stochastic, and Bollinger Bands to provide precise trading signals and market insights.
Trade balance measures a country's exports minus imports, revealing economic performance through a line graph that tracks trade surplus or deficit over time.
Likes, views, and comments are historical TradingView snapshots. They describe attention, not trading performance.