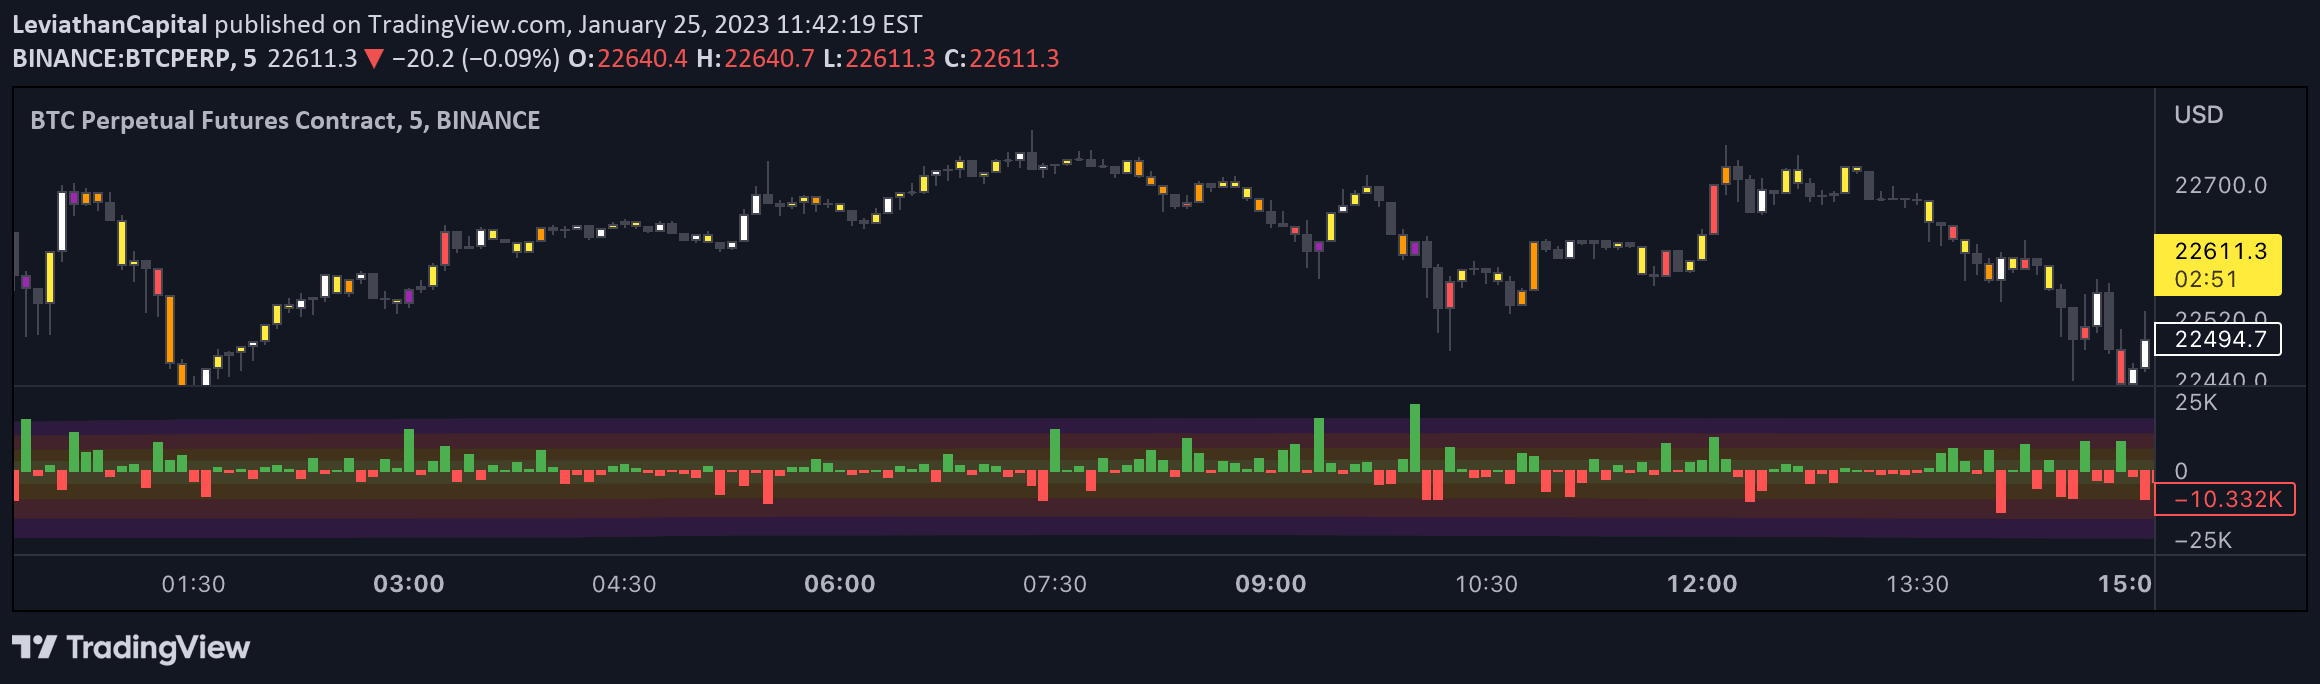
A logarithmic volume indicator that calculates delta between buying and selling volume to reveal market pressure and potential flash crash conditions.
Explore complementary indicator rolesHow it works
The Logarithmic CVD calculates volume delta by comparing buying and selling volumes across price candles. It identifies buying volume when the closing price is higher than the opening price and selling volume when the closing price is lower than the opening price.
The indicator then applies a logarithmic transformation to the volume delta, which helps scale and normalize the values. This transformation allows for better visualization of volume trends and provides insights into potential market movements by showing whether money is flowing in or out of an asset.
Why it may be useful
The Logarithmic CVD helps traders understand underlying market dynamics by revealing volume-based pressures that might not be immediately apparent from price action alone. By transforming volume data logarithmically, it provides a more nuanced view of market sentiment and potential trend reversals.
This indicator is particularly useful for identifying potential flash crash conditions and understanding the relative strength of buying and selling pressures. The smoothed logarithmic delta can help traders make more informed decisions about market entry and exit points.
When to explore it
The Logarithmic CVD is most effective in markets with significant volume fluctuations and during periods of potential trend changes. It works best in liquid markets where volume data is robust and can provide meaningful insights into market psychology.
Traders should use this indicator in conjunction with other technical analysis tools to confirm signals and validate potential trading opportunities. It is particularly useful for short-term trading strategies that rely on quick identification of market sentiment shifts.
Keep exploring
What we’ve verified
Access, alerts and repainting behaviour have not been independently verified for this indicator. Check the creator’s current publication and settings.
General descriptions and classifications are recovered research. Verified details above identify the specific checks we have completed. Check the creator’s current publication for later changes.