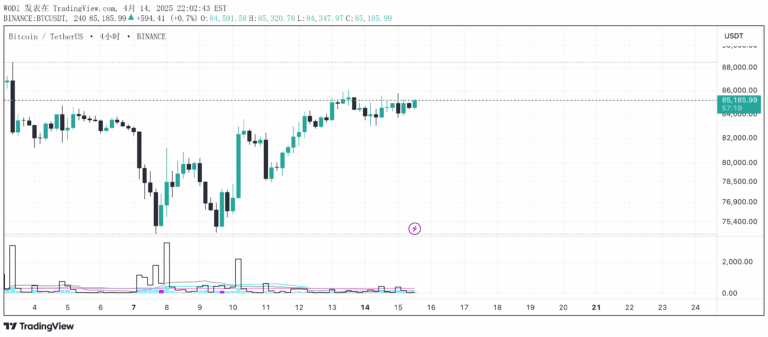
A volume-weighted mean reversion indicator using logarithmic transformations to analyze price and volume relationships, helping identify potential market bottoms and volatility zones.
Explore complementary indicator rolesHow it works
The LVDI calculates a volume-weighted Weighted Moving Average (WMA) by first computing the logarithmic WMA of the source data over a specified length. It then adjusts this value by the logarithmic ratio of current volume to average volume, creating a transformed metric that integrates price and volume dynamics.
The indicator further calculates a distance metric by comparing the logarithmic source data to the volume-weighted WMA. A score is generated by multiplying the sign of this distance with its squared absolute value, which potentially amplifies significant price-volume divergences and highlights potential market inflection points.
Why it may be useful
The LVDI provides traders with a nuanced view of market behavior by combining price and volume information through logarithmic transformations. By normalizing data and integrating volume weighting, it offers insights into potential market bottoms and volatility zones that might not be immediately visible through traditional analysis methods.
This approach helps traders understand underlying market dynamics, detect potential flash crash scenarios, and make more informed decisions about entry points and risk management. The logarithmic scaling makes the indicator particularly useful for assets with exponential growth characteristics, such as cryptocurrencies.
When to explore it
The LVDI works best in markets with significant price fluctuations and meaningful volume data, particularly in cryptocurrency and highly liquid trading environments. It is most effective when used in conjunction with other trend-following or confirmation indicators to validate potential entry or exit points.
Traders should be cautious about using this indicator in isolation and should combine it with additional technical analysis tools. It is particularly useful for identifying potential local bottoms, understanding market volatility, and supporting dollar-cost averaging (DCA) strategies in volatile market conditions.
Keep exploring
What we’ve verified
Access, alerts and repainting behaviour have not been independently verified for this indicator. Check the creator’s current publication and settings.
General descriptions and classifications are recovered research. Verified details above identify the specific checks we have completed. Check the creator’s current publication for later changes.