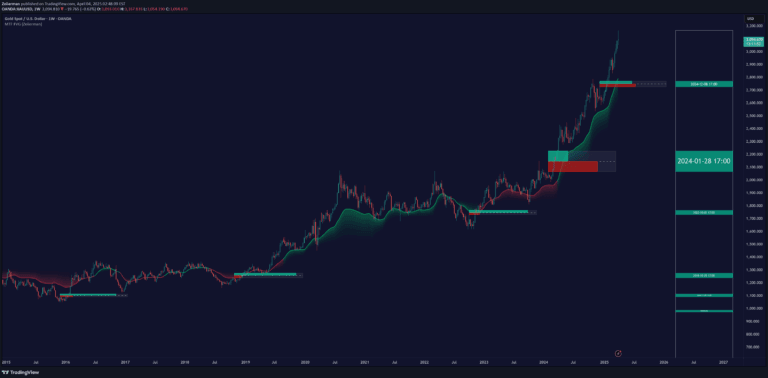
Breaker Blocks with Signals [LuxAlgo]
A trading indicator that identifies breaker blocks and highlights potential entry points by detecting price action around support and resistance zones with premium/discount swing levels.
Explore 11,183 indicators. Filter beyond the obvious.
Discover the tools that fit the way you trade.
11,183 tools to explore
A trading indicator that identifies breaker blocks and highlights potential entry points by detecting price action around support and resistance zones with premium/discount swing levels.
A technical analysis script that identifies cup-like price formations by creating channels and tracking potential breakout points in financial markets using specific bar search and channel width parameters.
A dynamic breakout trading indicator that identifies market movements through change in character and break of structure patterns, with integrated volume analysis and customizable take profit levels.
Wolfe Pattern is a trading strategy that identifies potential trend reversals by analyzing a specific wedge formation and drawing lines connecting key pivot points to determine entry and exit signals.
An advanced trading indicator that detects price imbalances through a three-candle formation, highlighting potential support and resistance zones based on supply and demand disparities.
An advanced trend channel indicator using pivot points and ATR to estimate trend direction quickly, with integrated candlestick pattern recognition for enhanced trading insights.
A multitimeframe indicator identifying institutional Fair Value Gaps through price imbalances, volume analysis, and trend filtering to highlight potential market inefficiencies and trading opportunities.
Advanced candlestick pattern recognition system that identifies 85 unique patterns across one to five candle formations, analyzing their statistical performance and potential market implications.
A comprehensive indicator that scans and highlights multiple reversal chart patterns like Double Tops, Cup and Handles, and Head and Shoulders using recursive zigzag analysis.
Multi-timeframe market formation tool that analyzes up to 6 different timeframes simultaneously, revealing market structure, support/resistance levels, and synchronization across time periods.
A comprehensive TradingView script that mimics MarketSmith charts, offering customizable moving averages, RS Rating, and high/low point detection for technical analysis.
A neural network-enhanced RSI indicator that uses advanced smoothing techniques to generate precise trading signals across different market conditions and visualization modes.
Likes, views, and comments are historical TradingView snapshots. They describe attention, not trading performance.