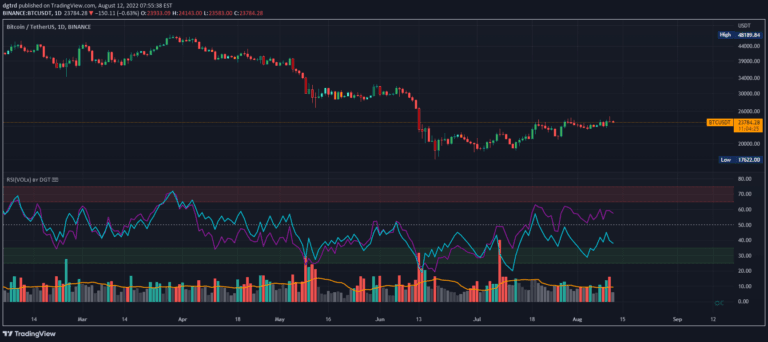
Strength of Divergence Across Multiple Indicators
A comprehensive divergence analysis tool that calculates divergence strength across multiple indicators, providing a single metric to assess potential market reversals and trend shifts.
Explore 11,183 indicators. Filter beyond the obvious.
Discover the tools that fit the way you trade.
11,183 tools to explore
A comprehensive divergence analysis tool that calculates divergence strength across multiple indicators, providing a single metric to assess potential market reversals and trend shifts.
A volume-based indicator that highlights key liquidity zones by detecting high-volume pivots and visualizing market activity through dynamic markers and support/resistance levels.
RSI is a momentum oscillator measuring price movement speed, analyzing price changes and volume to identify potential trend reversals and market conditions.
A real-time volume delta and tick indicator providing detailed insights into market dynamics by analyzing live trading updates, focusing on price action and volume information at small timeframes.
A trading signal identifying significant price movement at market open caused by extraordinary news, using the opening gap as a potential trading target.
A multi-faceted crypto trading indicator that tracks liquidation ranges, volume/OI dots, and identifies high-volume price areas using advanced volume and open interest analysis.
An advanced indicator analyzing open interest flows and price sentiment using Elder-Ray concept to assess market activity, trader positioning, and potential trend dynamics.
Session-based candles track price movements within specific global trading sessions, identifying session reversals and analyzing their performance using historical backtesting metrics.
Advanced RSI indicator with gradient-filled zones, divergence detection, and customizable settings to help traders identify market trends, potential reversals, and trading opportunities.
A comprehensive moving average indicator with multiple configuration options, featuring three advanced moving averages that can be customized with various inputs and visualization settings.
A mathematical trading indicator using Fourier transforms to analyze market cycles and generate trend signals by decomposing price movements into frequency components.
A visualization tool that stacks daily price changes by week, allowing traders to quickly analyze daily and weekly price movement patterns and volatility across different timeframes.
Likes, views, and comments are historical TradingView snapshots. They describe attention, not trading performance.