Global (World) Monetary Supply M2 (measured in USD)
Global Monetary Supply M2 tracks the monetary volume of the world's richest and most populous countries, measuring currency liquidity in USD.
Explore 11,183 indicators. Filter beyond the obvious.
Discover the tools that fit the way you trade.
11,183 tools to explore
Global Monetary Supply M2 tracks the monetary volume of the world's richest and most populous countries, measuring currency liquidity in USD.
The FVG Channel indicator tracks unmitigated fair value gaps to create dynamic trend channels that help identify market trends, potential reversals, and significant price levels.
A binary entropy function using price and volume to measure information content and generate trading signals based on statistical measurement of market movements and potential trend shifts.
A comprehensive SuperTrend indicator that integrates volume dynamics, trend detection, and multi-asset trend analysis with automated support/resistance level management.
A comprehensive trading indicator using Hull Moving Averages to detect trend continuations, volatility, and potential entry points across different market conditions.
Fibonacci Trading uses retracement and extension levels to identify potential support, resistance, entry points, and target levels in both upward and downward market waves.
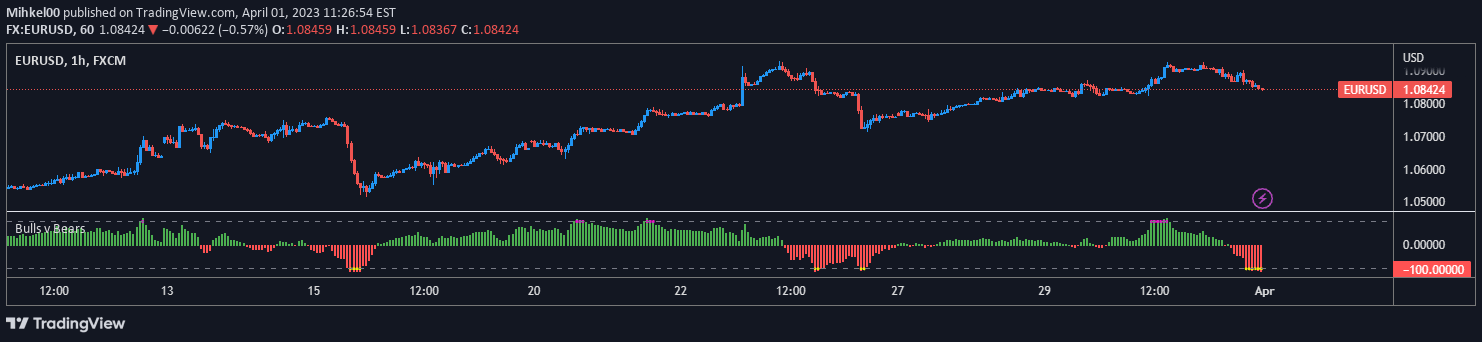
A market strength indicator that compares bullish and bearish momentum by normalizing the difference between price and moving average, helping traders identify potential trend changes.
An advanced TradingView indicator combining MACD with MA and ADX filters to generate more reliable trading signals and provide comprehensive backtesting capabilities.
A statistical indicator that transforms Least Squares Moving Average into a Z-Score, providing normalized trend analysis with adaptable color-coding to highlight market dynamics and potential reversals.
A harmonic pattern using three consecutive price drives and Fibonacci ratios to identify potential market reversals with high accuracy and strategic entry points.
A bull flag pattern identifies potential trend continuation by analyzing a brief consolidation period after an initial price surge, helping traders predict upcoming price movements.
A custom EMA-MACD indicator designed to identify trend direction, momentum shifts, and potential trading signals using multiple EMA lengths and MACD calculations.
Likes, views, and comments are historical TradingView snapshots. They describe attention, not trading performance.