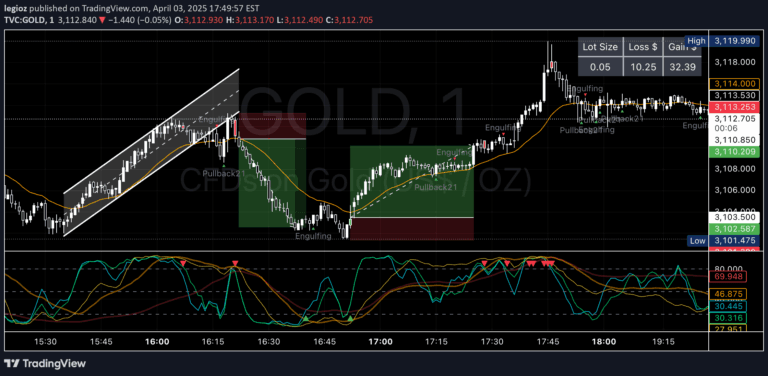
VWAP + 2 Moving Averages + RSI + Buy and Sell
A trading indicator that generates buy and sell arrows using VWAP, moving averages, and RSI to help traders identify potential market entry and exit points.
Explore 11,183 indicators. Filter beyond the obvious.
Discover the tools that fit the way you trade.
11,183 tools to explore
A trading indicator that generates buy and sell arrows using VWAP, moving averages, and RSI to help traders identify potential market entry and exit points.
A trading tool that calculates position size, risk, and potential gain for traders, supporting specific trading pairs and providing comprehensive trade analysis based on account parameters.
QuantumBands is a technical indicator based on Bollinger Bands that helps traders analyze market volatility and identify potential entry and exit points through price band crossovers.
A TradingView indicator that transforms candlestick colors using multiple pre-defined visual themes, enhancing chart aesthetics and personalizing trading visualization.
A daily open levels indicator that plots horizontal lines based on the day's opening price, helping traders identify key price zones and potential support/resistance levels for intraday trading.
Likes, views, and comments are historical TradingView snapshots. They describe attention, not trading performance.