Global Liquidity Index
Global Liquidity Index tracks worldwide central bank balance sheets, providing a comprehensive view of global monetary conditions and potential market trends through consolidated financial data.
Explore 11,183 indicators. Filter beyond the obvious.
Discover the tools that fit the way you trade.
11,183 tools to explore
Global Liquidity Index tracks worldwide central bank balance sheets, providing a comprehensive view of global monetary conditions and potential market trends through consolidated financial data.
The Ultimate RSI is an advanced oscillator that enhances traditional RSI by emphasizing trend dynamics, providing more precise insights into market momentum and directional movements.
A trading signal that analyzes price action in relation to volume pressure, providing insights into market trends through volume-based histograms and buy-sell convergence/divergence indicators.
A charting tool that tracks money flow and trading pressure across different price ranges, revealing market sentiment and significant price levels through buying and selling activity visualization.
An advanced MACD variant that normalizes momentum measurements and uses Heikin-Ashi candles to provide smoother trend analysis across different assets and timeframes.
An advanced Ichimoku-based oscillator that provides comprehensive market trend analysis by converting complex cloud components into a streamlined, color-coded momentum indicator.
A sophisticated trend indicator that uses triple smoothing to filter market noise and identify potential trend directions through moving average crossovers and dynamic color visualization.
A dynamic trend analysis tool that measures market momentum by tracking wave sizes, speed, and trend direction using advanced moving average techniques.
A probabilistic grid tool that visualizes potential price reversal locations using a 10x10 matrix, helping traders understand the likelihood of future market movements.
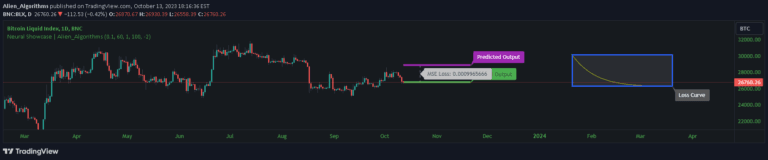
A neural network trading signal that generates price predictions using a single hidden layer with two neurons, demonstrating machine learning principles in technical analysis.
An advanced trend-following indicator combining SuperTrend methodology with normalized volume visualization to help traders identify market direction and volume intensity.
A spider chart visualization tool that combines multiple oscillators to provide a comprehensive view of market sentiment and trend dynamics using normalized indicators.
Likes, views, and comments are historical TradingView snapshots. They describe attention, not trading performance.