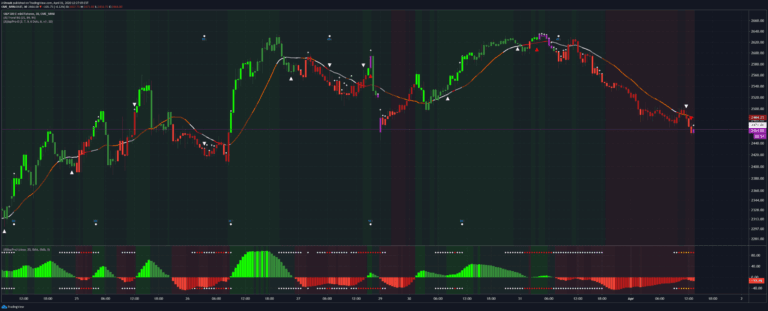
Renko Candles Overlay
Renko Candles Overlay is a charting technique that transforms price action into uniform-sized bricks, offering a simplified visual representation of market trends and price movements.
Explore 11,183 indicators. Filter beyond the obvious.
Discover the tools that fit the way you trade.
11,183 tools to explore
Renko Candles Overlay is a charting technique that transforms price action into uniform-sized bricks, offering a simplified visual representation of market trends and price movements.
A trading indicator that identifies the first fair value gap in a trading session, highlighting price imbalances and potential support/resistance zones with customized alerts.
A derivative RSI indicator using a Moving Average with a trailing stop level that generates buy and sell signals based on crossovers and market conditions.
A comprehensive multi-indicator script that displays various technical indicators in separate windows, allowing traders to customize and analyze market momentum, volume, and trend signals.
A range-based indicator that highlights price ranges to help identify potential breakouts and trading opportunities by visually marking key price levels and market movements.
A customizable Pine Script indicator that generates a mini-chart displaying the last 10 candles with detailed visual settings, providing quick insights into recent price action and market behavior.
A multi-feature trading signal indicator that identifies market squeeze conditions using Bollinger Bands and Keltner Channels with customizable overlay options for entry and exit signals.
A technical analysis tool combining MACD and RSI overlaid on price charts, offering traders insights into market momentum, trend direction, and potential trade signals.
A trading indicator that identifies liquidity sweeps and major liquidation events, helping traders anticipate market reversals and structure shifts through advanced volume and trend analysis.
MACD is a trend-following momentum indicator that reveals changes in price strength, direction, and duration by comparing two moving averages and their relationship.
A TradingView script enabling traders to display multiple candles from different timeframes on their current chart without altering the main chart's timeframe.
A comprehensive trading system using machine-engineered signals combining RSI, SuperTrend, and adaptive candle coloring for precise market entry and trend detection.
Likes, views, and comments are historical TradingView snapshots. They describe attention, not trading performance.