
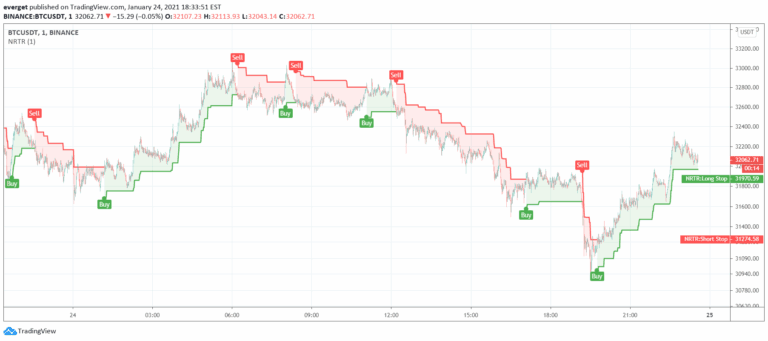
Nick Rypock Trailing Reverse (NRTR)
Nick Rypock Trend Reversal (NRTR) is a dynamic price channel indicator that tracks trend direction by measuring price extremes and percentage deviation from peak or bottom.
Explore 11,183 indicators. Filter beyond the obvious.
Discover the tools that fit the way you trade.
11,183 tools to explore
Nick Rypock Trend Reversal (NRTR) is a dynamic price channel indicator that tracks trend direction by measuring price extremes and percentage deviation from peak or bottom.
A sentiment oscillator that measures bullish and bearish market sentiment by analyzing price movements across multiple bars to provide trend and entry/exit signals.
A price action indicator that detects liquidity sweeps by identifying key swing points and tracking price movements through critical liquidity levels without complex numerical settings.
Peak Activity Levels indicator identifies support and resistance zones using volume peaks, displaying price levels where significant trading activity occurs and highlighting potential market turning points.
A pure price action indicator that detects order blocks and breaker blocks, identifying significant trading zones based on market structure and price movement patterns.
A dynamic support and resistance level indicator that scores potential trading zones based on volume, bounce frequency, and price interactions, providing visual insights into market structure.
A custom Donchian channel-based zig-zag indicator that tracks price extremities, offering unique insights into market movements and potential support/resistance levels.
An indicator that tracks historical all-time high levels, helping traders identify potential support and resistance zones based on past price peaks.
Top G Indicator helps traders identify market extremes by spotting high-probability tops and bottoms using dynamic range analysis and momentum shifts.
An advanced MACD indicator that analyzes positive and negative waves to filter false crossover signals and provide enhanced trading insights through wave height analysis.
A technical analysis method identifying divergences between price action and indicators to predict potential trend reversals or continuations in stock trading.
Regular Divergence is a technical analysis method that identifies potential trend reversals by comparing price movements with oscillator indicator patterns, revealing hidden market dynamics.
Likes, views, and comments are historical TradingView snapshots. They describe attention, not trading performance.