Solar System in 3D [Astro Tool w/ Zodiac]
An advanced 3D astrological trading indicator that renders planetary movements, aspects, and zodiac positions to provide unique market insights based on celestial body interactions.
Explore 11,183 indicators. Filter beyond the obvious.
Discover the tools that fit the way you trade.
11,183 tools to explore
An advanced 3D astrological trading indicator that renders planetary movements, aspects, and zodiac positions to provide unique market insights based on celestial body interactions.
Planetary Channel Lines analyze stock market trends by mapping planetary positions as support and resistance lines, using astronomical data to predict potential market turning points.
A planetary aspect oscillator that tracks the angular relationships between planets, offering unique insights into potential market influences through astrological energy measurements.
A chart overlay that highlights planetary aspects in financial markets, tracking the angular relationships between celestial bodies and their potential trading influences.
A celestial coordinate tracking system that maps planetary positions and key turning points using astronomical measurements to provide insights into celestial object locations.
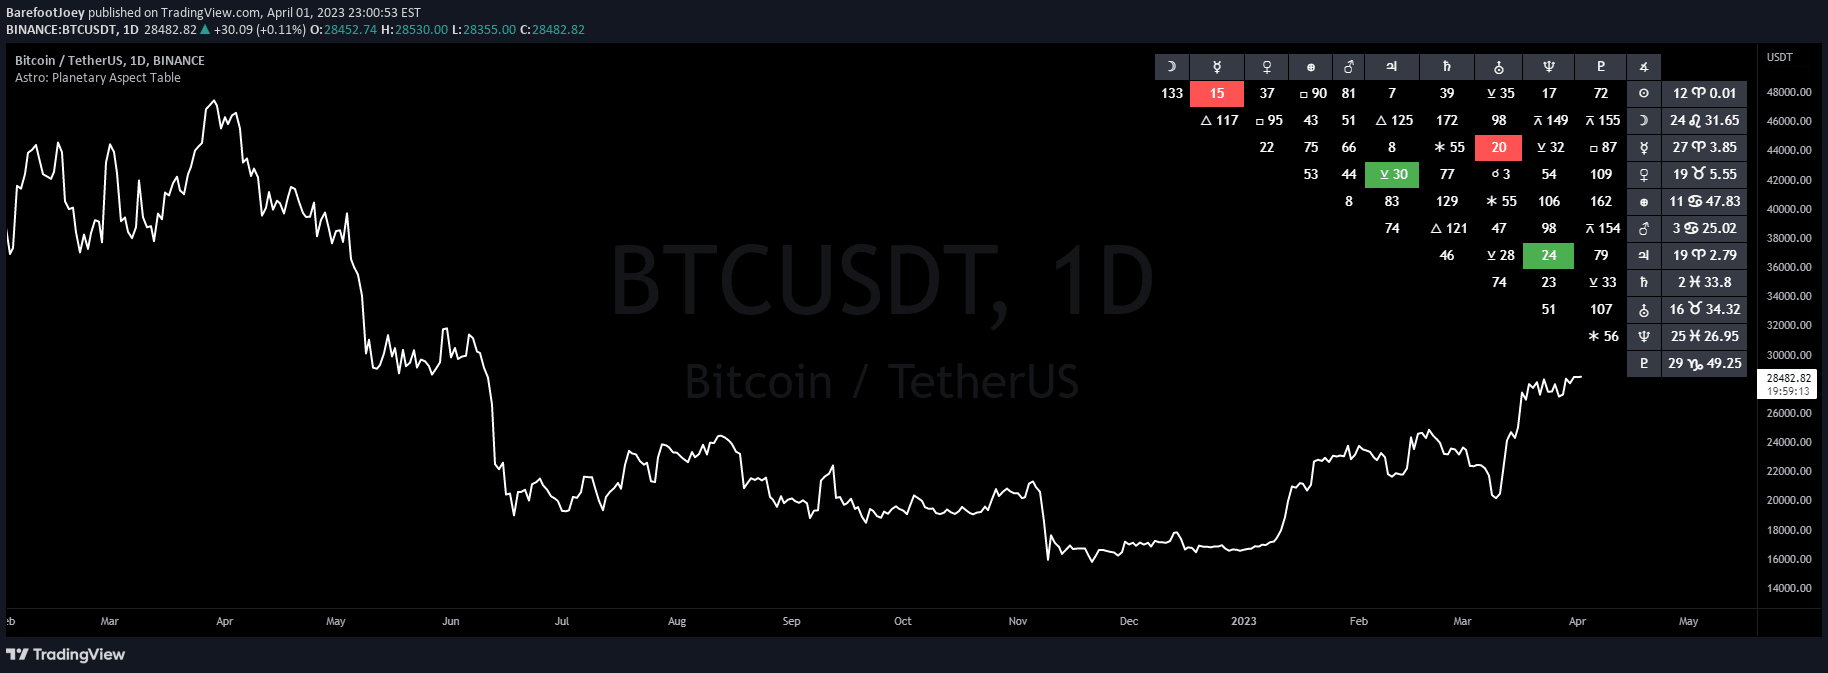
A planetary aspects chart overlay displaying real-time interplanetary angular relationships between celestial bodies, tracking their positions and potential energetic influences.
A planetary price and longitude indicator that maps celestial positions to market price movements, offering a unique perspective on market timing using astronomical data.
An astrological oscillator that measures planetary aspects by analyzing the angular relationships between planets, providing insights into potential market influences and energetic interactions.
Planetary speed explores how planets' orbital velocities can metaphorically represent market dynamics and trading energy, offering unique astrological insights into market movements.
A financial astrology tool that maps celestial body positions onto stock market charts, creating unique support and resistance lines based on planetary alignments.
A planetary-based market sentiment indicator that tracks astrological aspects and declinations to provide insights into potential shifts in mass psychology and market movements.
A unique trading indicator using planetary wavelengths to generate moving averages, transforming astronomical data into technical analysis with color-coded planetary tuning lines.
Likes, views, and comments are historical TradingView snapshots. They describe attention, not trading performance.