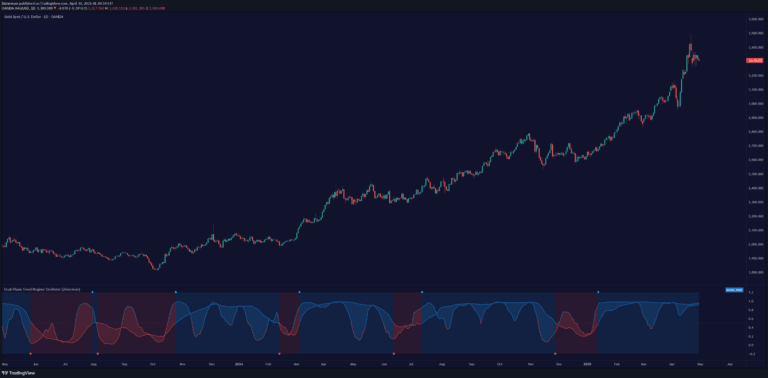
Dual-Phase Trend Regime Oscillator (Zeiierman)
A dynamic trend classification tool that adapts to market volatility by switching between slow and fast oscillators, providing insights into market trends and regime changes.
Explore 11,183 indicators. Filter beyond the obvious.
Discover the tools that fit the way you trade.
11,183 tools to explore
A dynamic trend classification tool that adapts to market volatility by switching between slow and fast oscillators, providing insights into market trends and regime changes.
A trading signal predicting potential price rises and falls by calculating RSI and TSI values, providing Long and Short labels on price-time charts.
A planetary price and longitude indicator that maps celestial positions to market price movements, offering a unique perspective on market timing using astronomical data.
A price-time trend filter that identifies market direction by comparing weekly or monthly bar closes to previous period's high and low ranges.
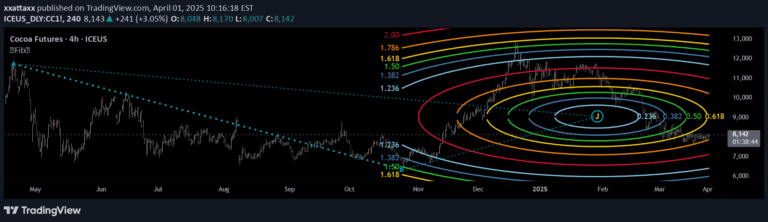
Fibonacci Circle Zones is a technical visualization tool that uses geometric circles to analyze price-time relationships, projecting potential support and resistance zones using advanced mathematical formulas.
Likes, views, and comments are historical TradingView snapshots. They describe attention, not trading performance.