Bjorgum Key Levels
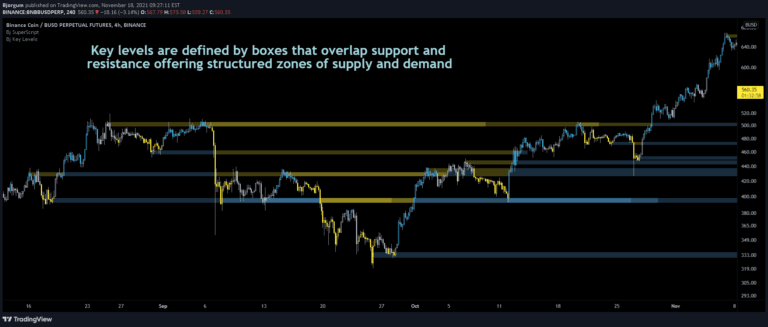
Key Levels strategy identifies critical price action points like breakouts, false breakouts, and backchecks to help traders understand market movement and potential trading opportunities.
Explore 11,183 indicators. Filter beyond the obvious.
Discover the tools that fit the way you trade.
11,183 tools to explore
Key Levels strategy identifies critical price action points like breakouts, false breakouts, and backchecks to help traders understand market movement and potential trading opportunities.
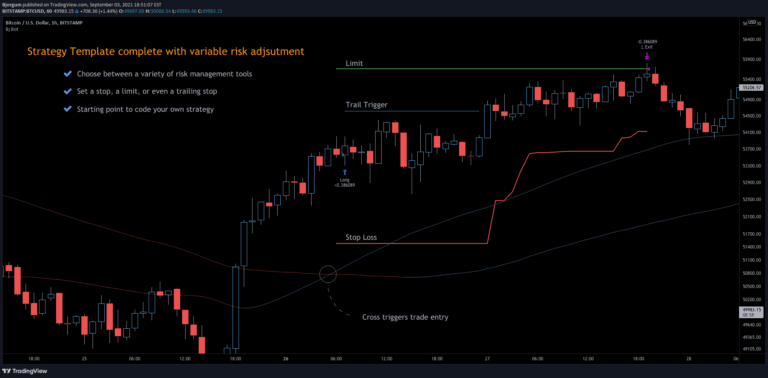
A 3Commas TradingView bot strategy offering automated trading with risk management, using moving average crossovers and customizable stop-loss and limit order settings.
Double Tap is a pattern recognition strategy that identifies double top and double bottom formations, providing entry signals based on price action reversals and breakout patterns.
A technical analysis tool designed to optimize trading strategies by evaluating risk-reward ratios across multiple indicators and providing comprehensive performance insights.
A sophisticated trend detection tool using Gaussian filtering and linear regression to identify market trends, minimize noise, and provide clear trading signals with dynamic volume insights.
Linear Regression Intensity is an advanced trend analysis tool that measures market trend strength using linear regression, offering dynamic color-coded insights into bullish, bearish, and neutral market conditions.
A script demonstrating time range backtesting techniques for trading strategies, enabling precise testing of entry and exit points within specific date ranges.
BjCandlePatterns is a comprehensive Japanese candlestick pattern recognition library that detects and labels various trading patterns to help traders identify potential market reversals and trend changes.
An advanced RSI indicator that dynamically determines the most profitable RSI length through machine learning techniques, adapting to changing market conditions and optimizing trading signals.
A market structure analysis tool combining order block detection, break of structure, and swing framework to help traders identify key price action shifts and potential trading opportunities.
A comprehensive indicator analyzing cryptocurrency wallet profitability by tracking on-chain data, showing percentages of wallets in profit, loss, or breaking even across different timeframes.
An advanced MACD variant using Z-Score normalization to identify statistically significant momentum shifts, providing clearer insights into price extremes and potential trend reversals.
Likes, views, and comments are historical TradingView snapshots. They describe attention, not trading performance.