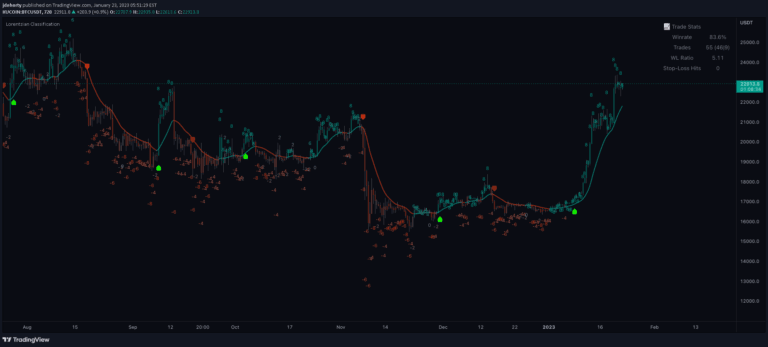
An advanced RSI indicator that dynamically determines the most profitable RSI length through machine learning techniques, adapting to changing market conditions and optimizing trading signals.
Explore complementary indicator rolesHow it works
The indicator systematically analyzes multiple RSI lengths to identify the most profitable configuration by evaluating crossings between RSI and its moving average. It scans different RSI lengths within a specified lookback period, tracking the profitability of each RSI length's crossings and determining the optimal length that generates the highest returns.
Once the optimal RSI length is identified, the indicator can apply machine learning techniques to further refine the signal. Users can choose between a simple average calculation or a k-Nearest Neighbour (KNN) approach, which compares different RSI lengths and their performance to generate more sophisticated trading insights.
Why it may be useful
Traditional RSI indicators often rely on fixed parameters like the standard 14-period length, which may not adapt to evolving market conditions. This advanced RSI approach dynamically adjusts its parameters based on historical performance, potentially providing more accurate and responsive trading signals.
By incorporating machine learning techniques, the indicator can identify subtle patterns and relationships between different RSI lengths that might be overlooked by conventional analysis. This adaptive approach allows traders to leverage data-driven insights and potentially improve their trading strategy's effectiveness across various market environments.
When to explore it
This RSI indicator is most effective in markets with consistent trend movements and clear oscillation patterns. It performs best in liquid markets with sufficient historical data to generate meaningful machine learning insights, such as major cryptocurrency pairs, forex markets, and actively traded stock indices.
Traders should consider using this indicator during periods of moderate market volatility, where RSI crossings and momentum shifts are more predictable. It is particularly useful for traders seeking a more dynamic and adaptive approach to momentum analysis, offering potential improvements over static RSI implementations.
Keep exploring
What we’ve verified
Access, alerts and repainting behaviour have not been independently verified for this indicator. Check the creator’s current publication and settings.
General descriptions and classifications are recovered research. Verified details above identify the specific checks we have completed. Check the creator’s current publication for later changes.