SuperTrend AI (Clustering) [LuxAlgo]
SuperTrend AI is an advanced machine learning technique that applies K-means clustering to the SuperTrend indicator, dynamically adapting trailing stop settings based on performance metrics.
Explore 11,183 indicators. Filter beyond the obvious.
Discover the tools that fit the way you trade.
11,183 tools to explore
SuperTrend AI is an advanced machine learning technique that applies K-means clustering to the SuperTrend indicator, dynamically adapting trailing stop settings based on performance metrics.
The Adaptive Trend Finder is an advanced trading indicator that autonomously detects trend channels using logarithmic scale regression, offering flexibility in long-term or short-term trend analysis.
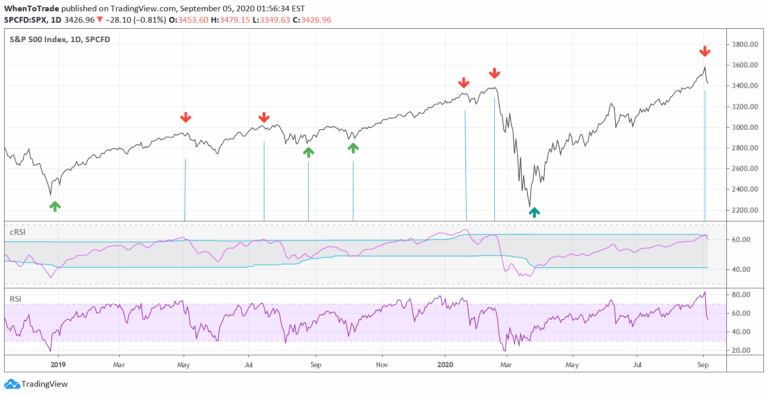
An enhanced RSI indicator that uses cyclic smoothing and adaptive bands to provide more responsive market trend signals by incorporating dominant cycle length.
An advanced trading indicator that identifies potential Fair Value Gaps during specific one-hour market sessions and highlights support/resistance levels for strategic entry and exit points.
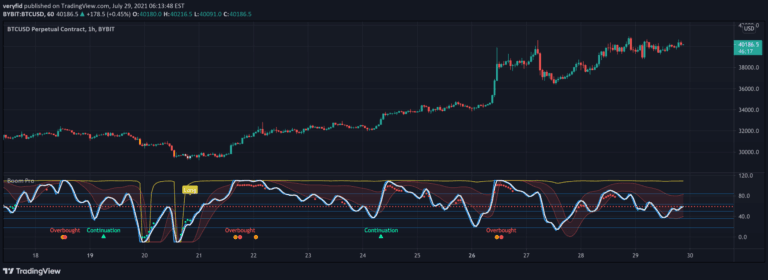
Boom Hunter Pro is an advanced trading indicator using Ehlers Early Onset Trend oscillator to identify potential long entries and short opportunities across different timeframes.
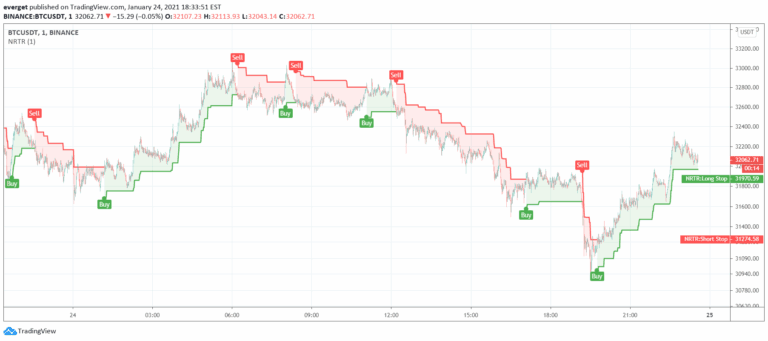
Nick Rypock Trend Reversal (NRTR) is a dynamic price channel indicator that tracks trend direction by measuring price extremes and percentage deviation from peak or bottom.
Day Trading Booster is a comprehensive trading tool designed to help traders identify optimal market entry and exit points by analyzing trading sessions, market volumes, and key price levels.
A dynamic trading indicator combining supertrend analysis with Fibonacci levels to identify market direction, support/resistance zones, and potential entry points.
A generalized Gaussian filter that smooths price data with variable pole orders, reducing noise and high-frequency market movements using advanced signal processing techniques.
A trading indicator that identifies the first fair value gap in a trading session, highlighting price imbalances and potential support/resistance zones with customized alerts.
Periodic Linear Regressions (PLR) calculates linear trend lines over customizable periods, helping traders identify underlying price trends and potential support/resistance zones.
A comprehensive trading indicator combining Parabolic SAR, EMA 200, and MACD to generate precise buy and sell signals by analyzing market trends and momentum.
Likes, views, and comments are historical TradingView snapshots. They describe attention, not trading performance.