SMT Divergences [LuxAlgo]
An indicator that identifies divergences between swing points of a chart symbol and two external tickers, providing statistical insights into price behavior correlation.
Explore 11,183 indicators. Filter beyond the obvious.
Discover the tools that fit the way you trade.
11,183 tools to explore
An indicator that identifies divergences between swing points of a chart symbol and two external tickers, providing statistical insights into price behavior correlation.
SMT Divergence identifies trend reversals by comparing price movements between two correlated financial assets, revealing potential market turning points through strategic divergence analysis.
SMT Divergence identifies potential market reversals by comparing price behaviors between two correlated assets, revealing subtle signs of market manipulation and trend shifts.
An advanced RSI indicator that dynamically determines the most profitable RSI length through machine learning techniques, adapting to changing market conditions and optimizing trading signals.
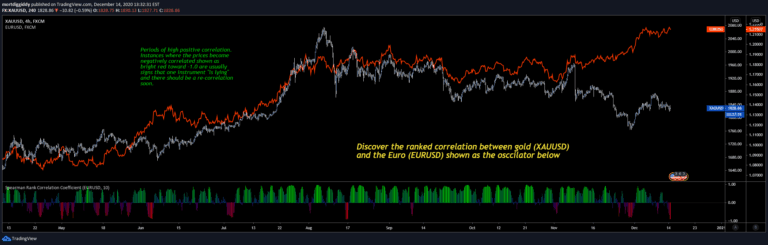
Spearman rank correlation coefficient measures the relationship between two variables by analyzing how they increase or decrease together, revealing potential market synchronization patterns.
Smart Money Technique Divergence identifies potential market shifts by analyzing discrepancies between correlated assets, revealing hidden market dynamics through pivot and liquidity analysis.
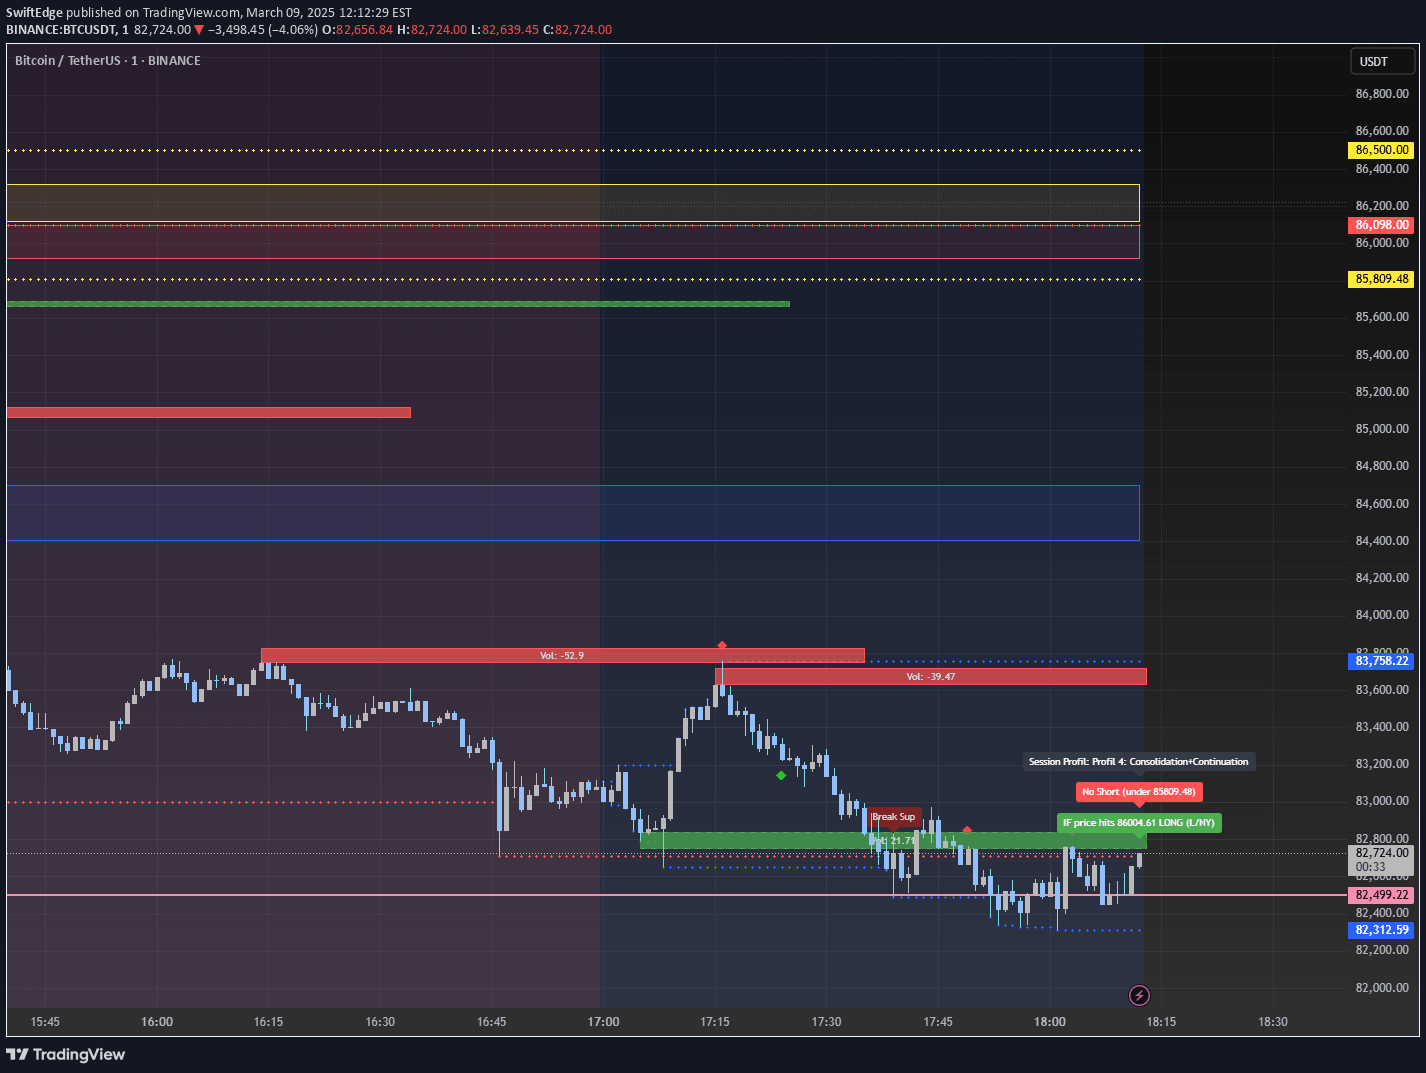
An advanced intraday trading indicator that predicts market profiles by analyzing session dynamics, combining Opening Range visualization, momentum signals, and support/resistance levels.
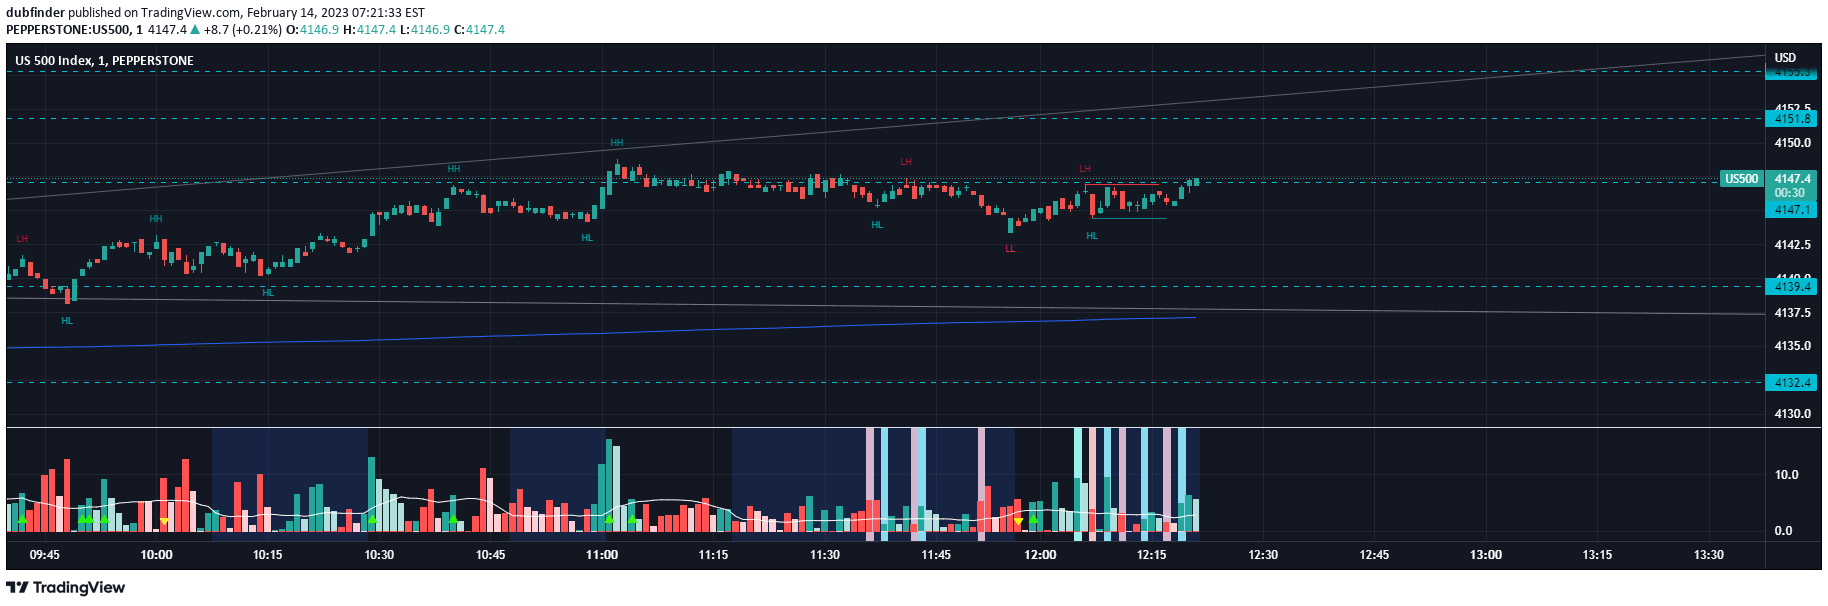
A hybrid trading signal combining Waddah Attar Explosion and Traders Dynamic Index to analyze market momentum, volatility, and potential breakout opportunities across different timeframes.
A crypto trading indicator that compares spot and futures market prices, helping traders identify price divergences and potential arbitrage opportunities in cryptocurrency markets.
A dynamic momentum indicator using the Traders Dynamic Index %K line with a 7-period moving average, providing visual insights into market momentum through color-coded histogram signals.
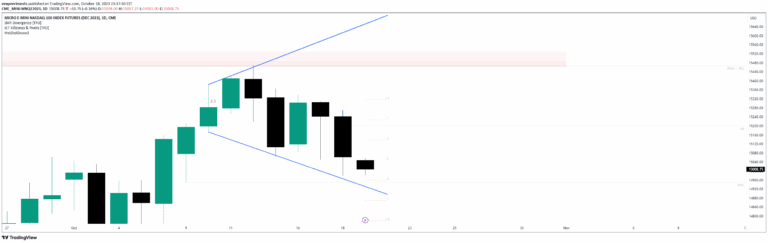
An advanced indicator that iterates on an existing script, offering customizable deviation calculations and automatic adjustments for multiple financial instruments and timeframes.
Likes, views, and comments are historical TradingView snapshots. They describe attention, not trading performance.