Treasury Yields Heatmap [By MUQWISHI]
Treasury Yields Heatmap is a dynamic tool tracking bond values and yield curve status across different countries using Pearson's linear regression coefficient.
Explore 11,183 indicators. Filter beyond the obvious.
Discover the tools that fit the way you trade.
11,183 tools to explore
Treasury Yields Heatmap is a dynamic tool tracking bond values and yield curve status across different countries using Pearson's linear regression coefficient.
A graph tracking earnings per share (EPS) growth using a trailing simple moving average, highlighting earnings recessions and expansions, with signals generated by earnings estimates.
A comprehensive visualization of U.S. Treasury Securities Yield Curve, displaying current and previous yield curves to help traders understand interest rate dynamics and market sentiment.
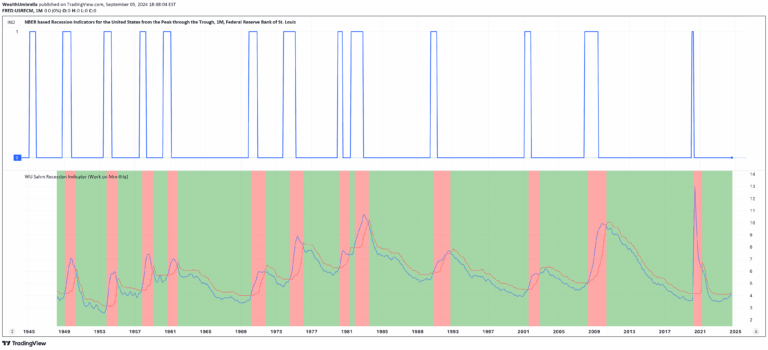
The Sahm Recession Indicator provides a real-time method to detect potential economic recessions by analyzing unemployment rate changes, helping traders anticipate market shifts.
A yield curve inversion indicator that tracks the relationship between different interest rates to predict potential economic recessions and market conditions.
A yield spread indicator comparing 10-year and 2-year US Treasury bond yields, providing insights into potential economic recessions and market corrections.
A technical indicator using James Hamilton's method to visually highlight US recession periods, providing macroeconomic context for trading decisions and economic analysis.
An advanced economic indicator that tracks the yield spread between 10-year and 2-year US Treasury rates to predict potential economic recessions and market shifts.
A comprehensive economic indicator that analyzes multiple U.S. economic metrics to predict potential recessions by tracking GDP discrepancies and consolidated economic signals.
A live data indicator that automatically shades official US recession periods based on monthly NBER data, providing visual context for economic cycles across all chart timeframes.
A TradingView indicator that visually highlights US economic recession periods directly on charts, allowing traders to analyze market behavior during historical economic downturns.
An economic indicator comparing Fed Funds Rate, US inflation, and 10-year bond yield to assess potential bond market conditions and macro trends.
Likes, views, and comments are historical TradingView snapshots. They describe attention, not trading performance.