Reversal
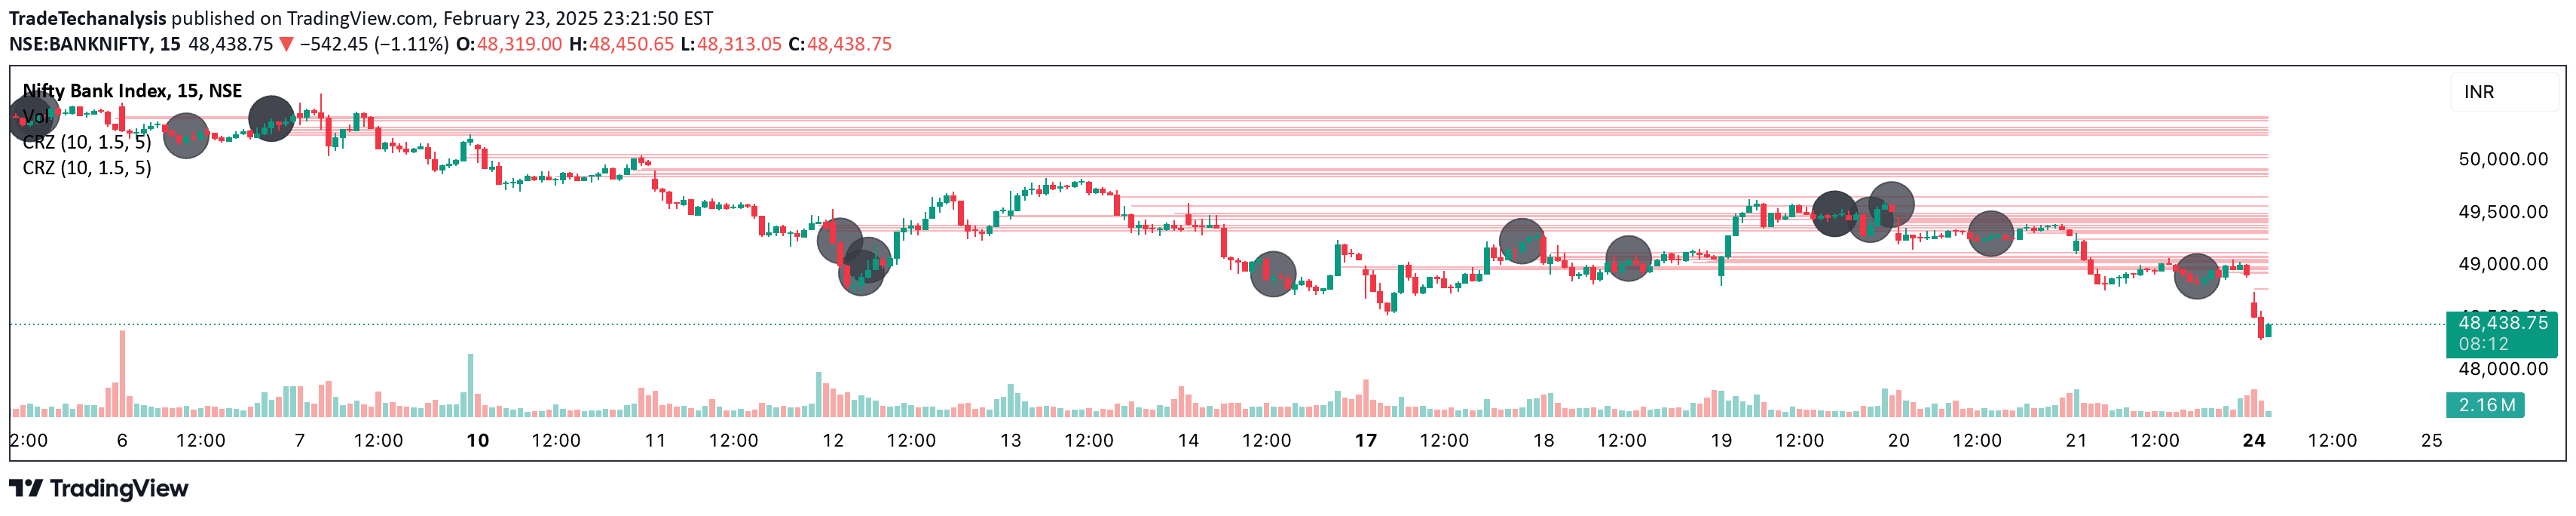
A candlestick analysis indicator designed to identify potential market reversals by detecting distinctive candle patterns that suggest significant price direction changes.
Explore 11,183 indicators. Filter beyond the obvious.
Discover the tools that fit the way you trade.
11,183 tools to explore
A candlestick analysis indicator designed to identify potential market reversals by detecting distinctive candle patterns that suggest significant price direction changes.
A dynamic support and resistance indicator that identifies key market levels using pivot points and customizable strength criteria to help traders make informed trading decisions.
A price action indicator that identifies potential mean reversion opportunities by tracking highest and lowest points within a selected lookback period and generating alerts.
Swing Failure Zones and Signals is an advanced trading indicator that identifies potential market reversals by detecting critical swing points and generating precise bullish and bearish signals.
A harmonic pattern using three consecutive price drives and Fibonacci ratios to identify potential market reversals with high accuracy and strategic entry points.
A comprehensive trading indicator combining Ichimoku, volume-weighted channels, color-coded candles, and extreme reversal zone detection to provide advanced market analysis.
The Deep Crab is a five-point harmonic pattern used to identify potential market reversals by analyzing precise Fibonacci retracement and extension levels.
A trading signal that identifies potential market reversal points by analyzing price action across short, mid, and long-term timeframes using surrounding bar comparisons.
Advanced market reversal detection tool that identifies high-probability turning points using price clustering, order flow analysis, and liquidity tracking for precise market entry and exit strategies.
An entropy-based indicator that identifies potential support and resistance zones by measuring price predictability and proximity to significant psychological levels.
A 3-bar reversal pattern that identifies potential market trend changes by analyzing consecutive bar closes. Helps traders spot short-term momentum shifts and potential entry/exit points.
Likes, views, and comments are historical TradingView snapshots. They describe attention, not trading performance.