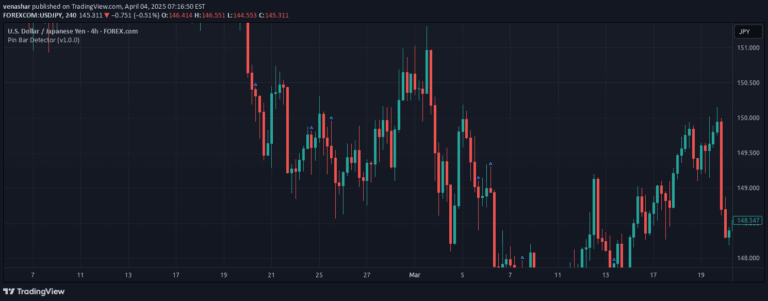
A candlestick analysis indicator designed to identify potential market reversals by detecting distinctive candle patterns that suggest significant price direction changes.
Explore complementary indicator rolesHow it works
The indicator begins by identifying the lowest or highest close within a specified number of previous candles, determined by the user's 'Candle Lookback' parameter. It then analyzes whether the current closing price surpasses the high of the previously identified candle within a user-defined 'Confirm Within' range, creating a systematic approach to detecting potential reversal signals.
This method allows traders to systematically track and evaluate candle patterns that deviate from the prevailing market trend. By comparing current price action against recent historical candle closes and highs, the indicator generates objective signals that highlight potential moments of market sentiment shift.
Why it may be useful
Candlestick reversal patterns provide traders with crucial insights into potential market turning points, offering a visual and quantitative method to anticipate price direction changes. These patterns help traders identify moments when market momentum might be losing steam or preparing to reverse, enabling more strategic entry and exit decisions.
By transforming subjective visual pattern recognition into a more structured, rules-based approach, this indicator reduces emotional trading and provides a consistent framework for identifying potential trend reversals. Traders can leverage these signals to make more informed decisions about market entry, exit, and risk management strategies.
When to explore it
This indicator works best in markets with clear trending characteristics, where price movements exhibit consistent directional momentum before potential reversals. It is particularly effective in volatile markets where quick sentiment shifts can create significant trading opportunities across different timeframes and asset classes.
Traders should apply this signal in conjunction with other technical analysis tools to confirm potential reversals, using it as part of a comprehensive trading strategy. It is most reliable when used on liquid markets with sufficient trading volume and when combined with additional confirmation indicators to validate the potential market direction change.
Keep exploring
What we’ve verified
Access, alerts and repainting behaviour have not been independently verified for this indicator. Check the creator’s current publication and settings.
General descriptions and classifications are recovered research. Verified details above identify the specific checks we have completed. Check the creator’s current publication for later changes.