
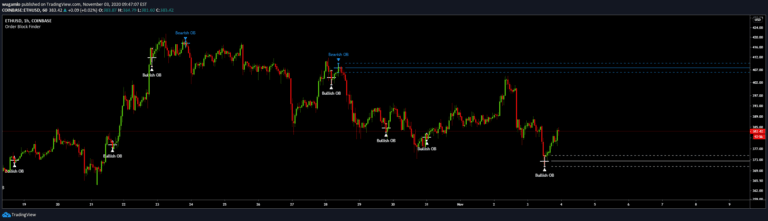
Order Block Finder (Experimental)
An indicator identifying institutional order blocks by detecting significant price zones where potential trend reversals or continuations might occur based on sequential candle patterns.
Explore 11,183 indicators. Filter beyond the obvious.
Discover the tools that fit the way you trade.
11,183 tools to explore
An indicator identifying institutional order blocks by detecting significant price zones where potential trend reversals or continuations might occur based on sequential candle patterns.
A multi-timeframe supply and demand indicator that identifies trading zones based on momentum candles, helping traders recognize potential support and resistance levels.
An advanced N-bar reversal pattern detector that identifies potential trend reversals by analyzing multiple consecutive candles and their price action, with customizable filtering options.
A price action scalping sequence identifying potential breakout opportunities by detecting two unsuccessful breakouts in the same direction, anticipating a third decisive move.
A trading signal that finds the most similar historical price sequences and projects future price movements using multiple similarity and correlation measures.
A market structure indicator that detects changes in price delivery state by analyzing sequences of candles and identifying potential trend continuations or reversals.
The Strat indicator provides a comprehensive trading toolkit for identifying candle numbers, pivot machine guns, custom combos, and generating various trading statistics.
A precise indicator that identifies double top and bottom reversal patterns in market price action, helping traders recognize potential trend changes with customizable settings and visual enhancements.
A trading tool that predicts market movements by analyzing historical candlestick colors and patterns, projecting future price action based on similar past events.
A trading indicator that identifies pivot points using Rally, Base, and Drop candles to determine supply and demand levels with structured market analysis.
The Three Drive pattern is a technical analysis formation that identifies potential trend reversals by analyzing a sequence of three consecutive price movements with decreasing momentum.
A Fibonacci Retracement tool that calculates potential support and resistance levels across multiple timeframes using both linear and logarithmic scales.
Likes, views, and comments are historical TradingView snapshots. They describe attention, not trading performance.