
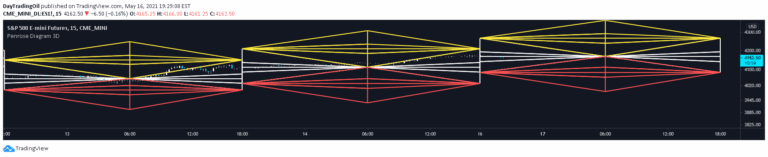
Penrose Diagram
A unique trading visualization technique that maps price movements using Penrose diagrams, transforming complex market data into a spatial representation of potential trading scenarios.
Main price chart · unverifiedDay Trading · Swing Trading
Explore 239likes10Kviews12comments