
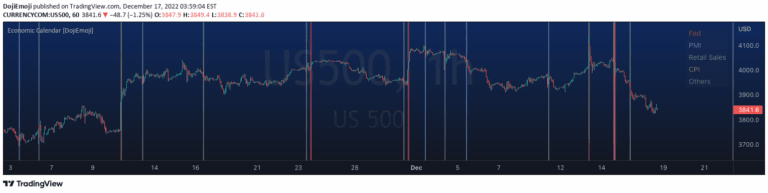
Economic Calendar (Import from Spreadsheet)
A trading script that automatically draws vertical lines marking economic calendar events using predefined datetime inputs, helping traders visually track significant market events.
Explore 11,183 indicators. Filter beyond the obvious.
Discover the tools that fit the way you trade.
11,183 tools to explore
A trading script that automatically draws vertical lines marking economic calendar events using predefined datetime inputs, helping traders visually track significant market events.
A cryptocurrency spread analysis tool that calculates correlation, z-score, and ATR z-score to help traders identify potential trading opportunities across different crypto pairs.
A proxy implementation of the Bloomberg Financial Conditions Index that assesses market stress by aggregating six key financial market components into a single standardized measure.
A yield curve indicator tracking the percentage of Treasury Bond yield spreads that are inverted, providing insights into potential economic downturns and market sentiment.
An advanced trend-following indicator that uses ATR, volume dynamics, and price spreads to generate precise buy and sell signals with dynamic trend bands.
A composite z-score indicator using credit spreads and volatility indexes to assess market conditions and generate trading signals based on real-time market data.
A yield curve analysis tool that tracks the relationship between 10-year and 2-year Treasury yields to identify potential economic shifts and market trends.
Global Yield Spread is an advanced economic indicator that analyzes bond yields across multiple countries to assess market conditions and potential investment opportunities.
A trading tool that helps visualize stop loss and take profit levels by plotting green and red dotted lines on the chart, allowing traders to quickly assess trade entry and exit points.
An automated tool for forex traders to calculate bond yield spreads between two countries, helping assess currency strength based on traded interest rates.
A statistical model analyzing price spread between two instruments using stationarity tests and Z-score to determine potential trading signals based on market deviation.
A TradingView alert utility that allows traders to set multiple complex conditions for webhook-based alerts, enhancing automated trading strategy flexibility and precision.
Likes, views, and comments are historical TradingView snapshots. They describe attention, not trading performance.