DEMA RSI Overlay [BackQuant]
A trading indicator combining Double Exponential Moving Average (DEMA) with Relative Strength Index (RSI) to generate responsive trend and momentum signals across different market conditions.
Explore 11,183 indicators. Filter beyond the obvious.
Discover the tools that fit the way you trade.
11,183 tools to explore
A trading indicator combining Double Exponential Moving Average (DEMA) with Relative Strength Index (RSI) to generate responsive trend and momentum signals across different market conditions.
An advanced trading concept that identifies overnight price gaps in futures markets, using specific time frames and standard deviation projections to analyze potential market movements and liquidity zones.
An enhanced trend indicator that adds a third standard deviation level for more precise trend analysis. Provides faster and simplified tracking of market movements.
A dual standard deviation channel indicator that measures price volatility across two different time lengths, helping traders identify potential overbought and oversold conditions.
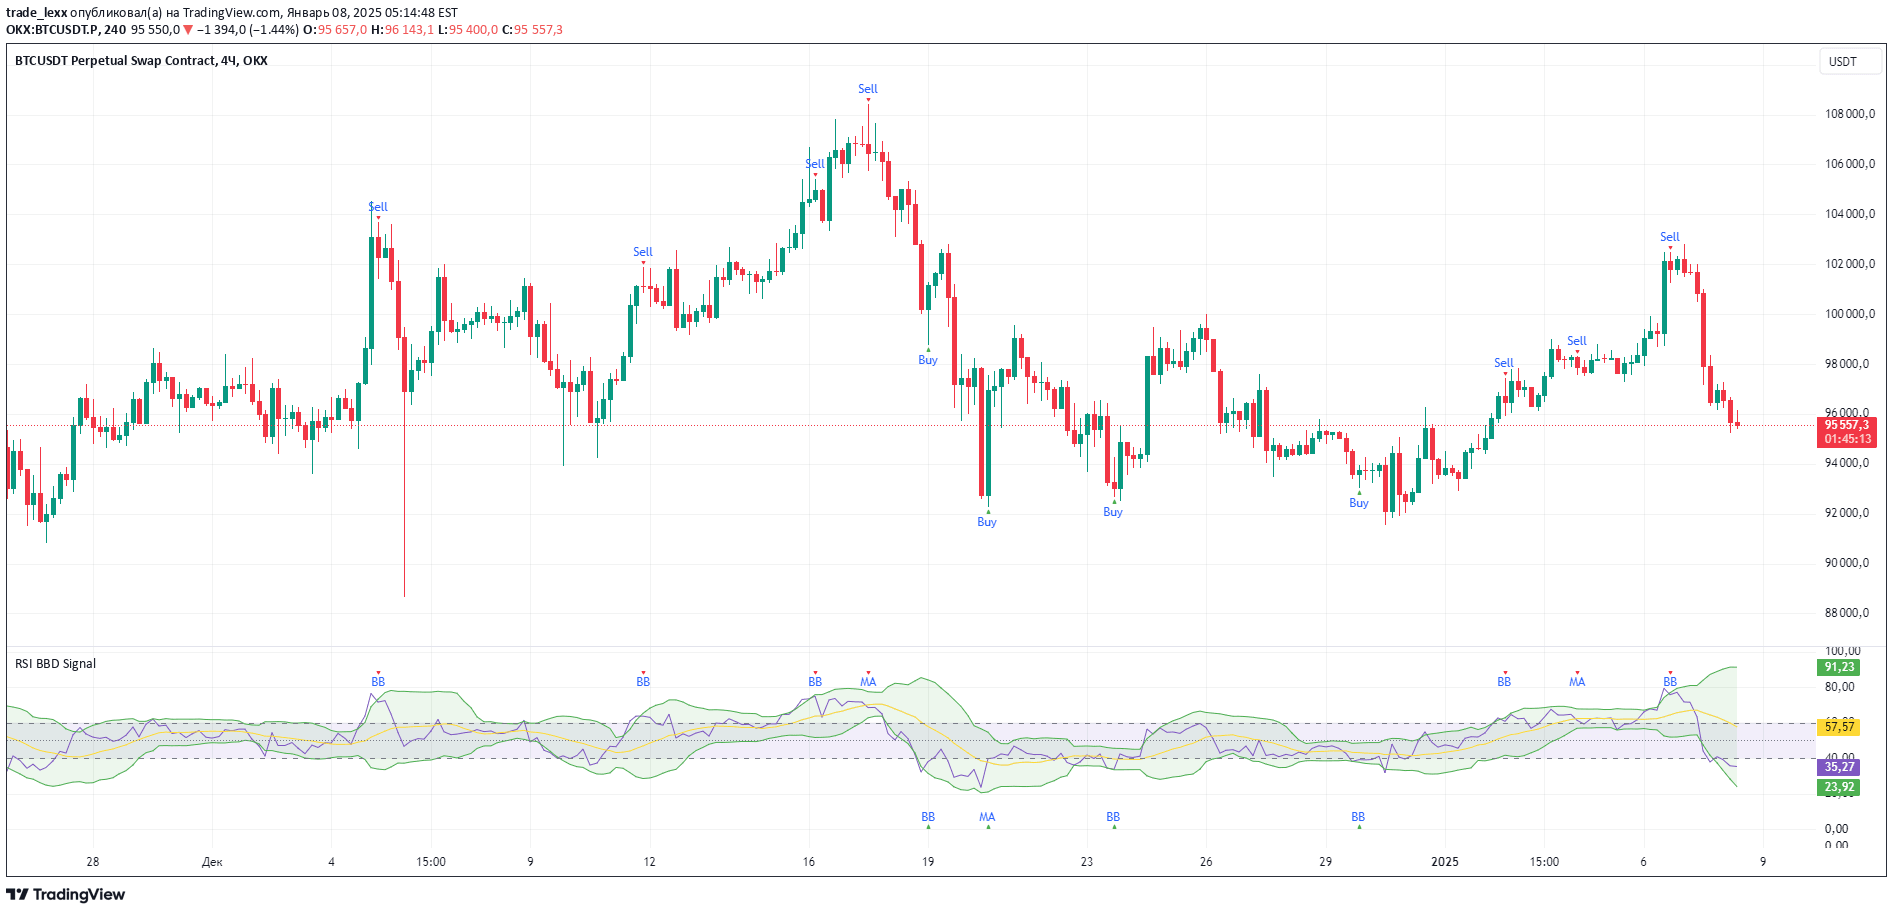
A trading indicator that combines RSI and Bollinger Bands to generate precise buy and sell signals by analyzing price momentum and volatility within a dynamic range.
A Chaikin Oscillator that reveals extreme changes in accumulation and distribution momentum, helping traders identify potential trend shifts and hidden market dynamics.
A comprehensive deviation indicator using multiple moving averages and VWAP to analyze market volatility across different timeframes, providing dynamic support and resistance levels.
A dynamic trading indicator that calculates a session midpoint and adaptive standard deviation bands to assess market sentiment, support/resistance, and potential price reversals.
A dynamic indicator that measures price deviation from a moving average using standard deviation bands, providing visual insights into market movement and potential trend changes.
A linear regression indicator with standard deviation bands that helps identify price trends, potential support and resistance levels, and market momentum through dynamic price analysis.
Tracks year-over-year changes in central bank assets using statistical bands to identify unusual monetary policy shifts and liquidity trends in global markets.
A statistical trend analysis tool that uses linear regression to determine market direction and volatility, plotting a best-fit line with optional standard deviation bands for deeper market insights.
Likes, views, and comments are historical TradingView snapshots. They describe attention, not trading performance.