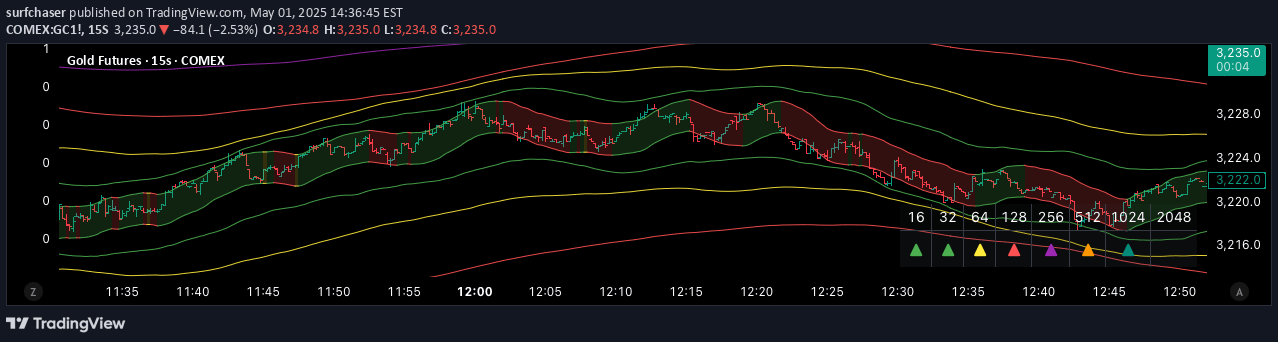
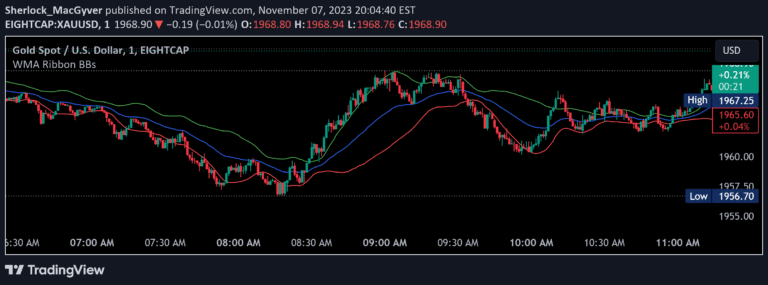
A linear regression indicator with standard deviation bands that helps identify price trends, potential support and resistance levels, and market momentum through dynamic price analysis.
Explore complementary indicator rolesHow it works
The linear regression indicator calculates a best-fit line through price data over a specified period, representing the average price trend. This line is then surrounded by upper and lower bands created by adding and subtracting standard deviation multiples from the regression line.
The bands dynamically expand and contract based on price volatility, creating a flexible framework for analyzing market movement. Traders can customize the regression length, standard deviation multiplier, and price source to fine-tune the indicator's sensitivity and precision.
Why it may be useful
The linear regression with standard deviation bands provides traders with a comprehensive view of market trends, helping them understand price momentum and potential reversal points. By visualizing the average price movement and its surrounding volatility, traders can make more informed decisions about entry and exit points.
This indicator offers multiple layers of market analysis, combining trend direction, support and resistance levels, and overbought/oversold conditions in a single tool. Its adaptability allows traders to adjust parameters to match different market conditions and trading styles.
When to explore it
The linear regression indicator works best in markets with clear directional trends and moderate volatility, where price movements are relatively consistent. It is particularly useful in trending markets where prices tend to oscillate around a central regression line, providing clear signals for potential trades.
Traders should be most cautious when using this indicator during periods of extreme market volatility or during major economic announcements, as rapid price changes can create false signals and reduce the indicator's reliability.
Keep exploring
What we’ve verified
Access, alerts and repainting behaviour have not been independently verified for this indicator. Check the creator’s current publication and settings.
General descriptions and classifications are recovered research. Verified details above identify the specific checks we have completed. Check the creator’s current publication for later changes.