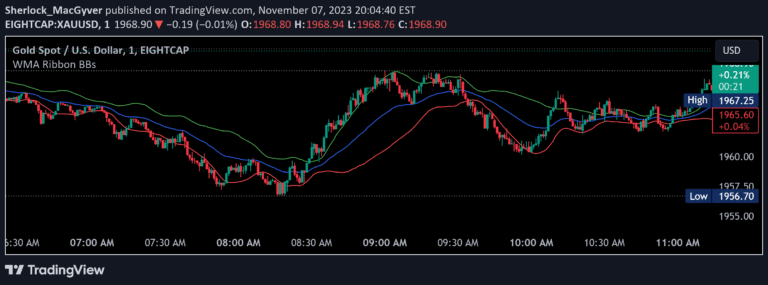
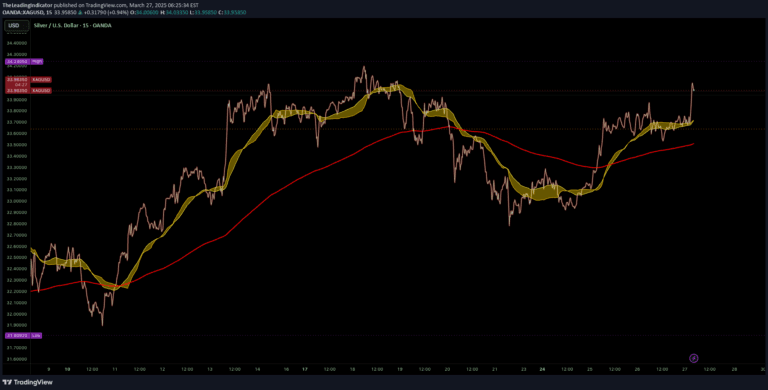
A cycle analysis tool using eight moving averages with customizable lengths, types, and band offsets to track price movements and provide dynamic trend visualization.
Explore complementary indicator rolesHow it works
The tool generates eight moving averages with configurable parameters like length, type (RMA, WMA, EMA, SMA), and offsets. It creates upper and lower bands around each moving average using percentage or point-based calculations, allowing traders to adapt the bands to different market conditions.
The bands can be configured using various progression methods like Linear, Exponential, ATR-Based, Geometric, Harmonic, Square Root, and Fibonacci. These methods provide flexibility in defining band widths, enabling traders to customize the indicator's sensitivity to price movements and market volatility.
Why it may be useful
This multi-moving average tool provides traders with a comprehensive view of market trends and potential price movements across different timeframes. By offering multiple moving averages with configurable bands, traders can gain deeper insights into market dynamics and potential trend changes.
The flexible band generation methods allow traders to adapt the indicator to different market conditions, making it valuable for identifying trend strength, potential reversals, and volatility shifts across various trading styles and asset classes.
When to explore it
The indicator is most effective in markets with clear trend characteristics, such as forex, stocks, and futures during periods of consistent directional movement. It works best when traders want to analyze multiple timeframes simultaneously and need a nuanced view of price momentum.
Traders should use this tool when seeking to confirm trend directions, identify potential trend reversals, and adjust their trading strategies based on dynamic market conditions. It is particularly useful for traders who value customization and want a flexible, multi-layered trend analysis approach.
Keep exploring
What we’ve verified
Access, alerts and repainting behaviour have not been independently verified for this indicator. Check the creator’s current publication and settings.
General descriptions and classifications are recovered research. Verified details above identify the specific checks we have completed. Check the creator’s current publication for later changes.