Bjorgum Key Levels
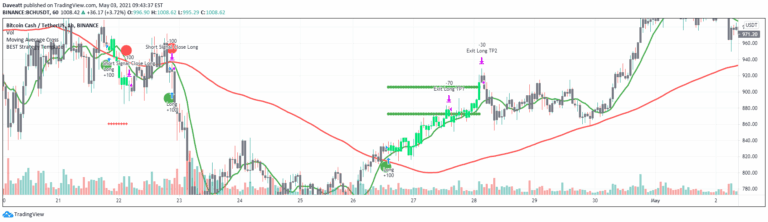
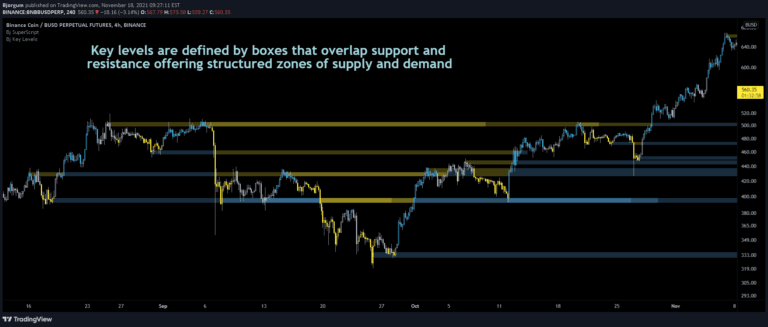
Key Levels strategy identifies critical price action points like breakouts, false breakouts, and backchecks to help traders understand market movement and potential trading opportunities.
Explore 11,183 indicators. Filter beyond the obvious.
Discover the tools that fit the way you trade.
11,183 tools to explore
Key Levels strategy identifies critical price action points like breakouts, false breakouts, and backchecks to help traders understand market movement and potential trading opportunities.
Breakout Probability indicator calculates the likelihood of new market highs or lows by analyzing historical price action and displaying percentage probabilities for potential price levels.
A volume-based support and resistance indicator that identifies key trading levels through pivot points and volume analysis, providing visual cues for potential price reversals.
A universal strategy template for TradingView that allows traders to convert any indicator into a tradable strategy with comprehensive risk management and backtesting features.
Auto-generated Fibonacci Retracements that identify market structure shifts and potential support/resistance zones based on technical breaks and price action dynamics.
A trading indicator that identifies swing point tests and retests, highlighting potential breakout areas with color-coded zones and triangular markers to signal market movement.
An advanced trading indicator implementing the ICT Turtle Soup strategy, which identifies liquidity zones and market structure shifts to generate precise entry and exit signals for traders.
An experimental trading signal applying the Logistic Map Equation to popular indicators like Awesome Oscillator, ROC, RSI, and Stochastic to generate unique market insights through iterative mathematical calculations.
A comprehensive trading framework designed to help traders develop, analyze, and manage trading strategies with advanced risk and reward tracking capabilities across multiple market conditions.
A momentum-based trading signal that measures price changes over time, using speed and acceleration principles to identify potential trend directions and trading setups.
A trading tool that identifies entry points by retesting the average price between two swing points, using volatility and user-defined parameters to generate precise trade signals.
A dynamic trendline indicator that tracks market trends across three different timeframes, using swing points and color-coded visualizations to highlight potential trend shifts and price movements.
Likes, views, and comments are historical TradingView snapshots. They describe attention, not trading performance.