Liquidity Pools
A liquidity indicator that identifies potential market order zones by mapping swing highs and lows, revealing where stop-loss orders and significant liquidity pools are likely positioned.
Explore 11,183 indicators. Filter beyond the obvious.
Discover the tools that fit the way you trade.
11,183 tools to explore
A liquidity indicator that identifies potential market order zones by mapping swing highs and lows, revealing where stop-loss orders and significant liquidity pools are likely positioned.
A specialized price tracking indicator displaying previous day, week, and month's high and low price levels, adaptable across different timeframes to help traders identify key historical price reference points.
A MACD indicator that visually displays trend strength by changing colors based on the expanding or contracting range between MACD and signal lines.
A moving average deviation indicator that helps traders identify potential price reversals by measuring how far price has moved from its average, with customizable moving average types and signal options.
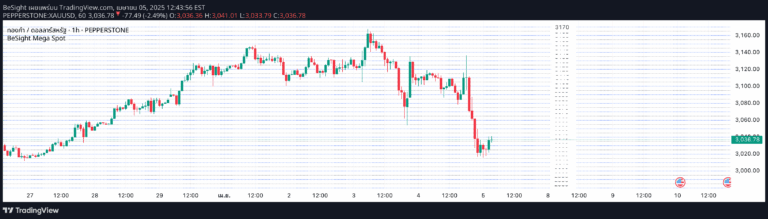
A custom indicator that calculates real-time Thai gold prices by converting global gold rates and exchange rates, allowing flexible weight and purity customization for precise local market pricing.
A price grid indicator that highlights key trading zones based on price levels ending in 0 and 5, helping traders identify potential institutional behavior and market reaction points.
Likes, views, and comments are historical TradingView snapshots. They describe attention, not trading performance.