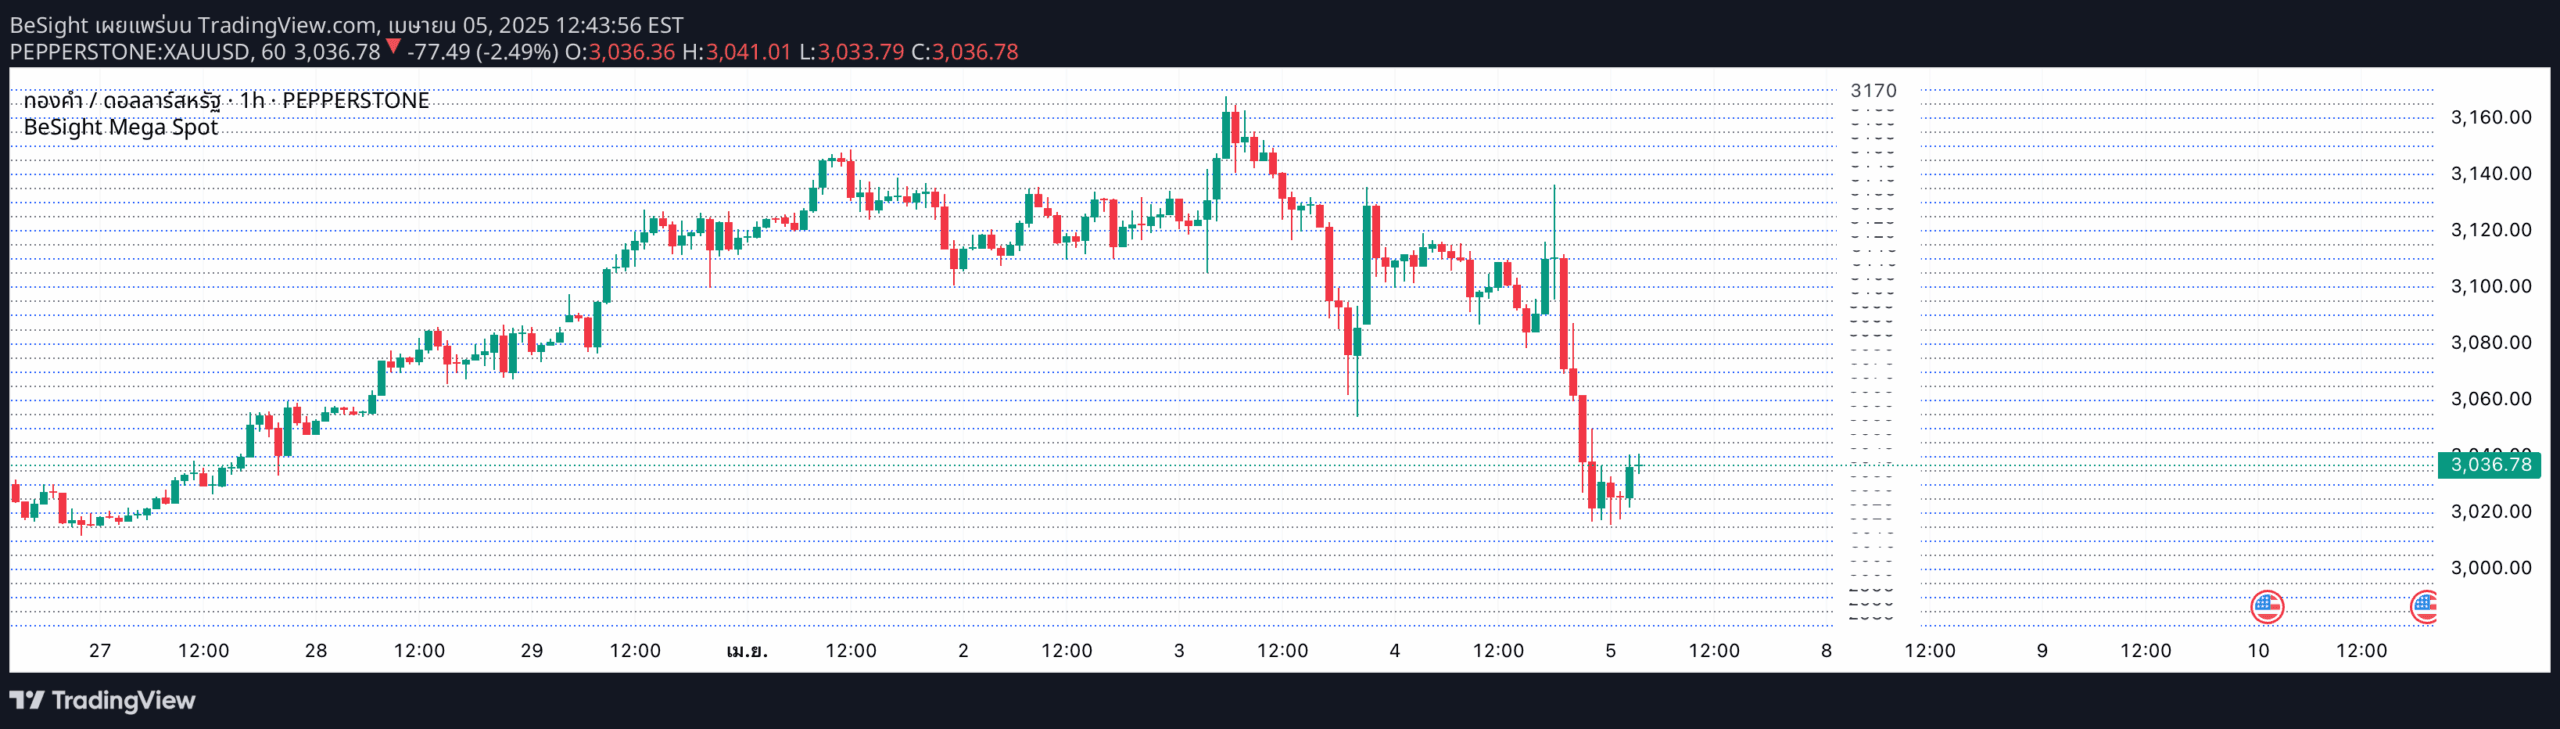
A price grid indicator that highlights key trading zones based on price levels ending in 0 and 5, helping traders identify potential institutional behavior and market reaction points.
Explore complementary indicator rolesHow it works
The BeSight Mega Spot indicator creates horizontal grid lines across the chart at fixed intervals, specifically targeting price levels ending in 0 and 5. Blue lines represent levels ending in 0, while gray lines represent levels ending in 5.
These lines cover the entire visible price range, providing a visual map of potential price clustering zones. The grid helps traders quickly identify key psychological price levels where market participants might place pending orders or show significant trading interest
Why it may be useful
This indicator is crucial for traders seeking to understand market structure and potential institutional behavior. By visualizing price zones where significant trading activity might occur, traders can gain insights into possible support, resistance, and consolidation areas.
The grid helps identify potential liquidity zones and price reaction points that might not be immediately apparent. It provides a structured approach to analyzing price movement and can enhance decision-making by offering a broader perspective on market dynamics
When to explore it
The BeSight Mega Spot is most effective when used in conjunction with other technical analysis tools like Supply/Demand zones or Smart Money Concepts. It works best in markets with clear price structures and consistent trading patterns.
Traders should use this indicator during periods of ranging or consolidating markets where psychological price levels play a significant role. It is particularly useful for identifying potential breakout, retest, or reversal scenarios across various financial instruments
Keep exploring
What we’ve verified
Access, alerts and repainting behaviour have not been independently verified for this indicator. Check the creator’s current publication and settings.
General descriptions and classifications are recovered research. Verified details above identify the specific checks we have completed. Check the creator’s current publication for later changes.