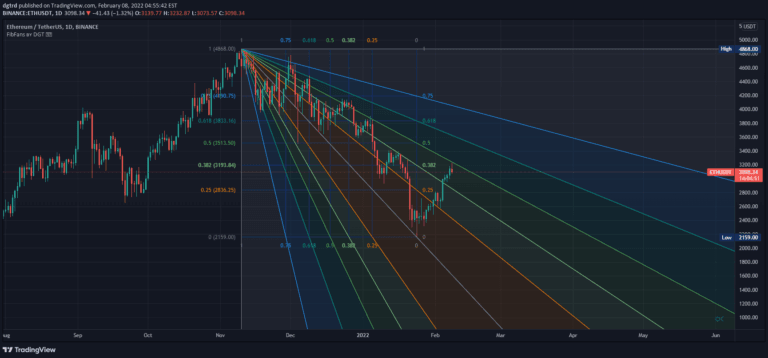
Auto Fib Speed Resistance Fans by DGT
Fibonacci Speed and Resistance Fan is an analytical tool that identifies potential support and resistance levels by drawing lines based on Fibonacci percentages to predict trend changes and market movements.
Explore 11,183 indicators. Filter beyond the obvious.
Discover the tools that fit the way you trade.
11,183 tools to explore
Fibonacci Speed and Resistance Fan is an analytical tool that identifies potential support and resistance levels by drawing lines based on Fibonacci percentages to predict trend changes and market movements.
Automated Fibonacci tool that simplifies technical analysis by drawing retracement and extension levels, helping traders identify potential market turning points and price targets.
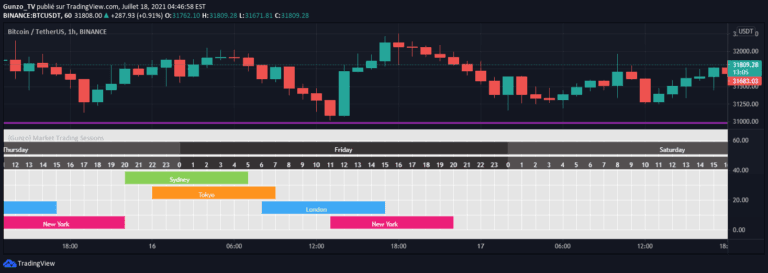
Market Trading Sessions tool helps traders identify optimal trading times by visualizing non-overlapping global market sessions across different time zones and regions.
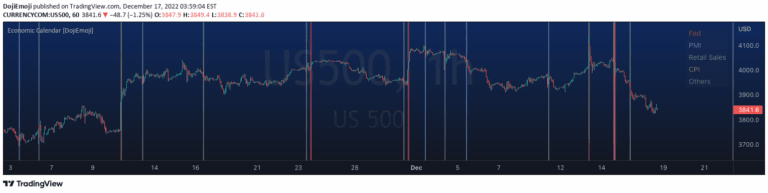
A trading script that automatically draws vertical lines marking economic calendar events using predefined datetime inputs, helping traders visually track significant market events.
A price tracking indicator that shows multiple time-based levels including daily, weekly, and monthly open, high, and low prices with customizable color and line style settings.
A trading tool that marks key session high and low levels across global market sessions, helping traders identify significant price zones and potential trading opportunities.
An advanced trading indicator that highlights key market time zones and trading windows across London and New York sessions, helping traders identify potential entry and exit points.
A visual indicator that highlights the trading gap between previous day's closing price and current day's opening price, showing potential price filling opportunities.
A specialized trading signal that identifies and marks the 12:00 AM New York timezone candle, providing traders with a specific time-based market reference point.
A market cycle indicator that visualizes price phases including accumulation, manipulation, distribution, and reversal to help traders identify potential entry and exit points.
A session-based statistical indicator that calculates price projections using standard deviation, helping traders visualize potential support and resistance levels within specific trading sessions.
A customizable vertical line indicator that helps traders segment trading days by marking hourly intervals and specific time events on their charts.
Likes, views, and comments are historical TradingView snapshots. They describe attention, not trading performance.