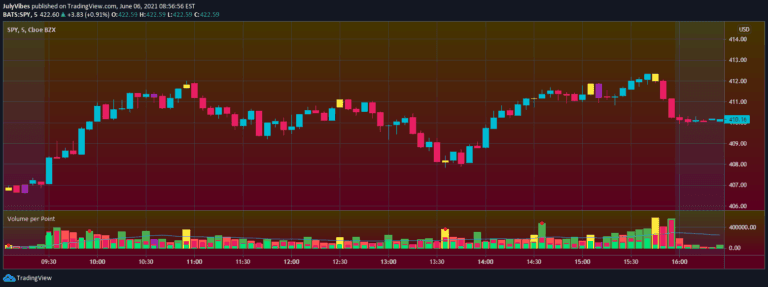
Volume per Point
Volume per Point (VP) indicator tracks volume efficiency by analyzing volume relative to price movement, revealing market maker activity and potential trading opportunities through color-coded signals.
Explore 11,183 indicators. Filter beyond the obvious.
Discover the tools that fit the way you trade.
11,183 tools to explore
Volume per Point (VP) indicator tracks volume efficiency by analyzing volume relative to price movement, revealing market maker activity and potential trading opportunities through color-coded signals.
A range filter indicator using Nadaraya-Watson Envelope with custom SMA overlays to predict potential price trend changes and reversals with custom signal generation.
A specialized technical indicator designed to identify unique market volume imbalances by detecting specific candlestick patterns that signal potential significant price movements.
A comprehensive market session indicator that provides real-time trading insights, displaying market sessions, daily high/low values, and key moving averages on a trading chart.
An advanced indicator that identifies inside bar patterns, detecting breakouts and fakeouts with three distinct scenarios to help traders recognize potential market movement opportunities.
A statistical analysis tool using Nadaraya-Watson estimation to create probability bands around price movements, revealing potential market trends and volatility insights.
A trading script that detects significant daily price gaps, helping traders identify potential breakouts and reversals by analyzing price differences between market sessions.
A trading strategy that triggers buy signals at 50% retracement and sell signals when price breaks above previous high, providing systematic entry and exit points.
A specialized trend indicator using two SMA configurations with angular slope thresholds, designed to help traders identify market trends and potential entry/exit points.
Local Polynomial Regression (LPR) is an advanced statistical method for estimating market trends by fitting flexible polynomial regression at each data point using weighted least squares.
A trading indicator that identifies unique market scenarios by detecting specific candlestick patterns with high potential for significant price movements and volume imbalances.
A comprehensive technical analysis approach combining multiple indicators to identify market trends, entry/exit points, and manage risk through adaptive strategies.
Likes, views, and comments are historical TradingView snapshots. They describe attention, not trading performance.