QT RSI [ W.ARITAS ]
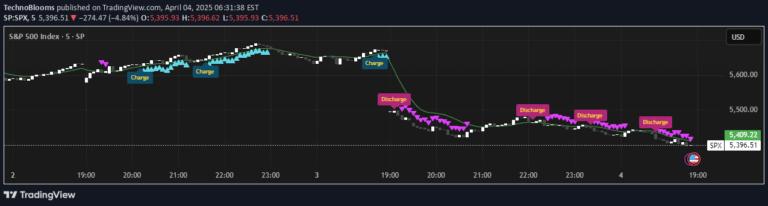
QT RSI is an advanced quantum-enhanced technical indicator using machine learning to analyze market trends, providing color-coded signals for precise trading decisions across various asset classes.
Explore 11,183 indicators. Filter beyond the obvious.
Discover the tools that fit the way you trade.
11,183 tools to explore
QT RSI is an advanced quantum-enhanced technical indicator using machine learning to analyze market trends, providing color-coded signals for precise trading decisions across various asset classes.
A sophisticated Volume Zone Oscillator that uses Wavelet and Fourier transforms to analyze price and volume trends, reducing market noise and providing clearer trading signals.
A wavelet-enhanced Awesome Oscillator that uses multi-scale filtering to detect momentum shifts and trend reversals with improved accuracy across different market conditions.
A quantum-inspired trading indicator that uses physics principles to detect market energy shifts, identifying trend momentum through entropy, volatility, and price acceleration analysis.
A wavelet-inspired moving average that uses three levels of smoothing to detect trends and reduce noise while providing deeper market structure insights.
An advanced wavelet filtering system that decomposes price data into frequency components, removes noise, and reconstructs signals to enhance trend detection and market analysis.
A high-resolution trading indicator using wavelet transforms to analyze market pressure by combining price and volume data with advanced signal processing techniques.
An advanced market analysis indicator using fractal dimension, entropy, and Mexican Hat Wavelet to assess price complexity, volatility, and potential market shifts across different timeframes.
Likes, views, and comments are historical TradingView snapshots. They describe attention, not trading performance.