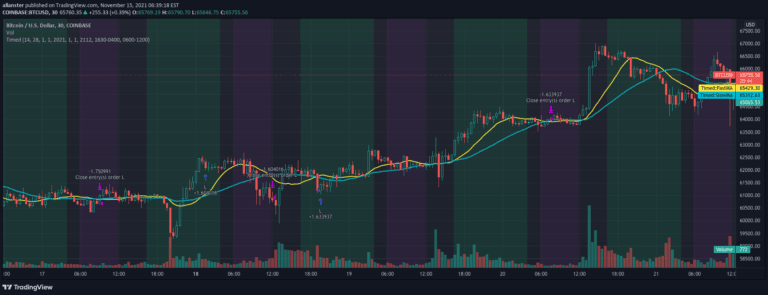
How To Set Backtest Time Ranges
A script demonstrating time range backtesting techniques for trading strategies, enabling precise testing of entry and exit points within specific date ranges.
Explore 11,183 indicators. Filter beyond the obvious.
Discover the tools that fit the way you trade.
11,183 tools to explore
A script demonstrating time range backtesting techniques for trading strategies, enabling precise testing of entry and exit points within specific date ranges.
A trading tool that plots expected price move boxes using implied volatility from options, helping traders visualize potential price ranges for weekly, monthly, and yearly timeframes.
CME Bitcoin Futures gap identification tool that tracks price disparities during market closures, helping traders recognize potential price reversion opportunities.
A specialized trading tool that identifies and visualizes price gaps in cryptocurrency markets, focusing on weekend trading sessions and potential price movements.
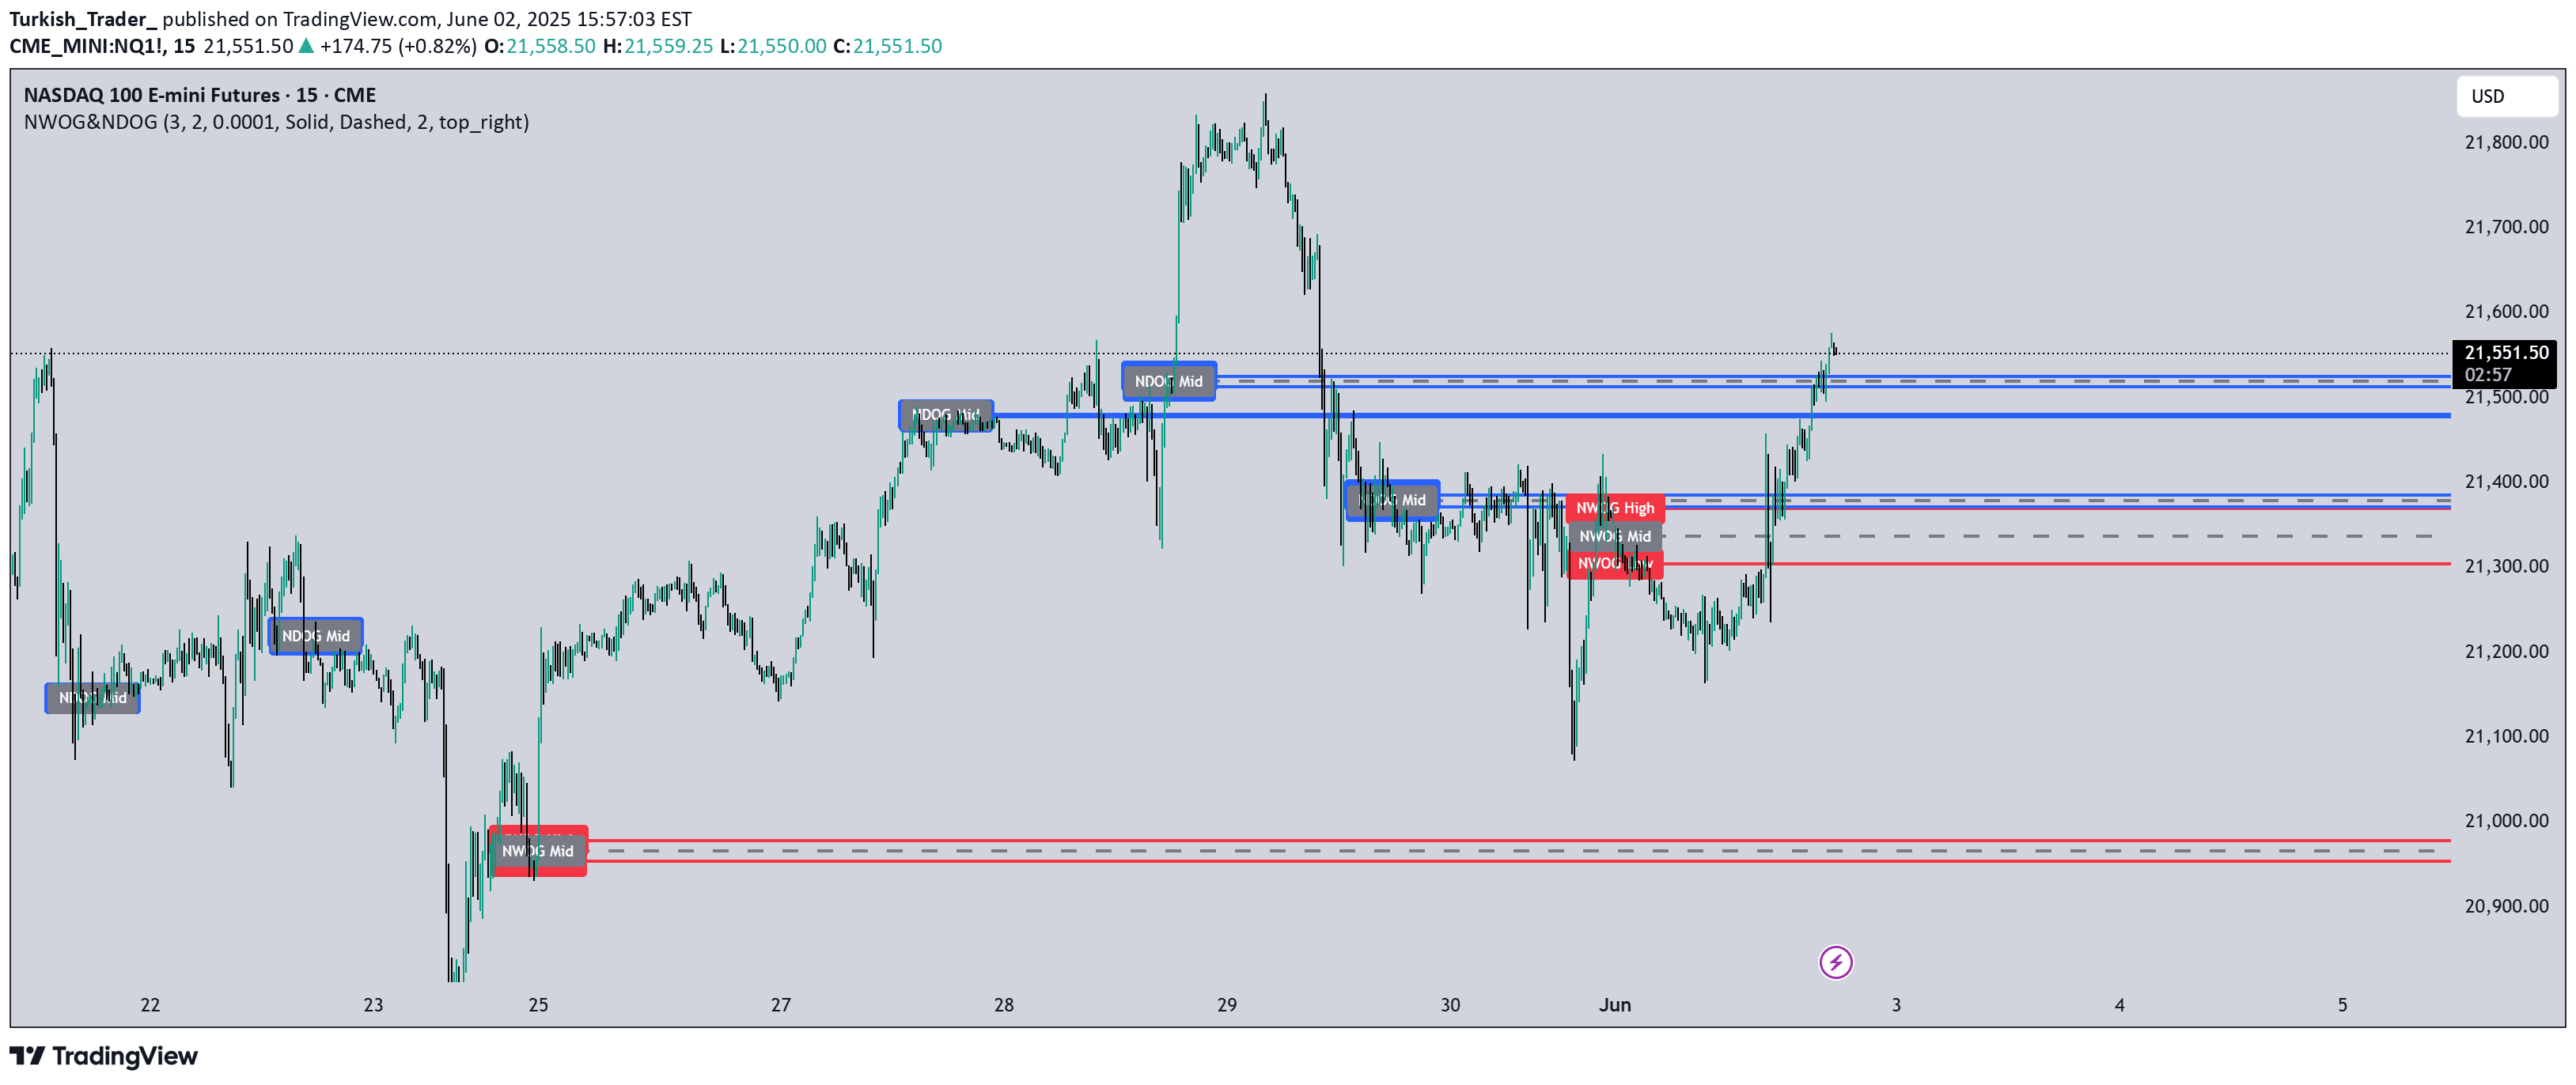
A specialized trading indicator that identifies and visualizes New Day Opening Gaps (NDOG) and New Week Opening Gaps (NWOG) based on specific New York timezone session times.
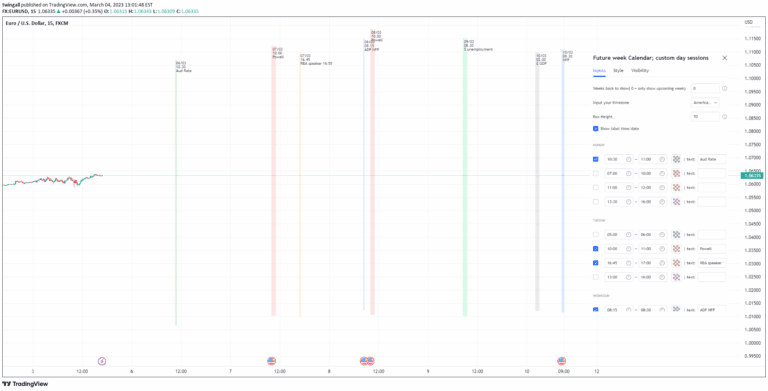
A customizable on-chart calendar that allows traders to mark and track multiple intraday trading sessions with flexible configuration options for different timeframes.
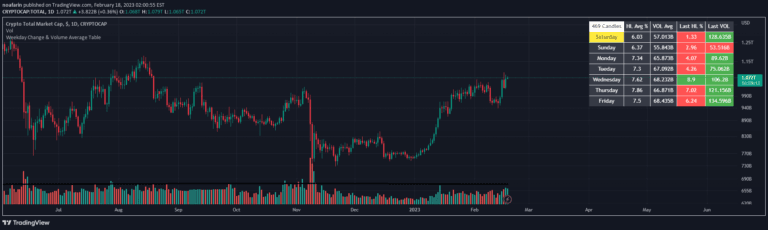
A script analyzing price movement and trading volume patterns across different weekdays, helping traders understand market behavior and potential trading opportunities.
A technical tool tracking weekly price gaps in XAUUSD, revealing market sentiment and potential trading opportunities by analyzing the weekend price difference.
A technical analysis tool that highlights daily trading patterns by visually marking specific days of the week, helping traders identify potential market behavior trends across different timeframes.
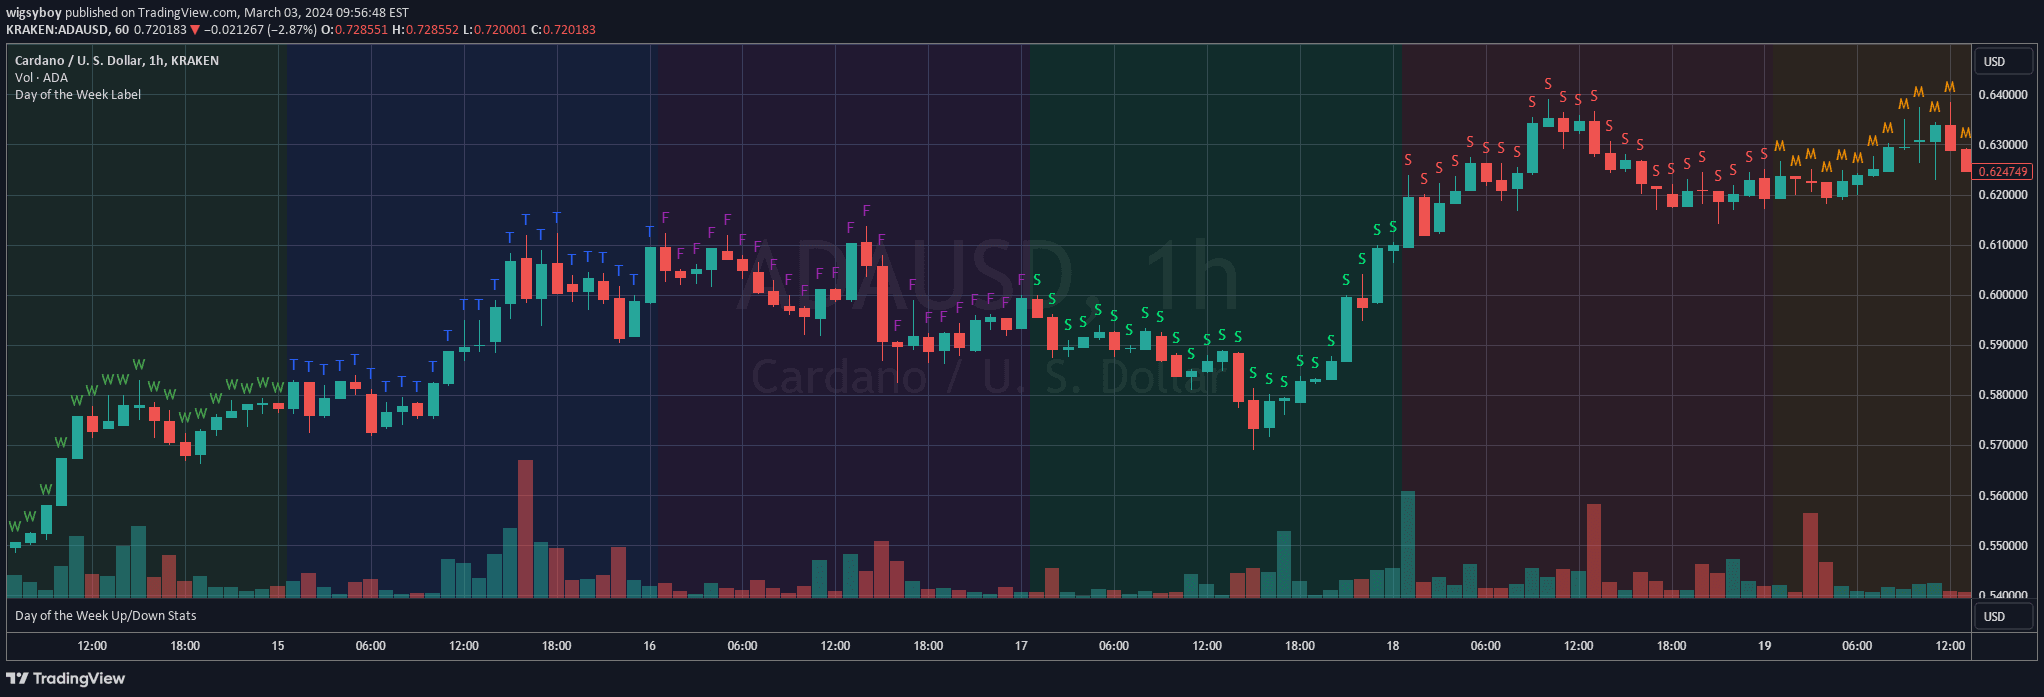
A TradingView chart overlay that adds day of the week labels to candlesticks, helping traders quickly identify and analyze daily trading patterns.
A CME gap analysis tool that measures weekend market gaps using Average True Range, providing insights into market volatility and potential trend shifts through dynamic level tracking.
A visual indicator highlighting weekend trading periods with color-coded boxes that display percentage price changes, helping traders quickly analyze weekend market volatility and movements.
Likes, views, and comments are historical TradingView snapshots. They describe attention, not trading performance.