RedK EVEREX - Effort Versus Results Explorer
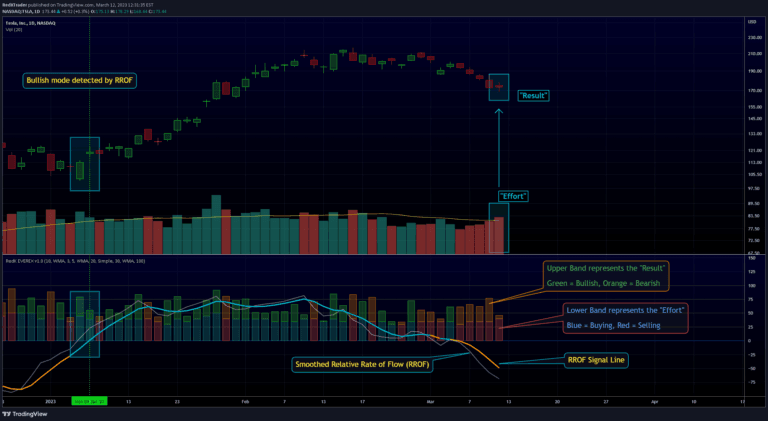
An experimental trading indicator that analyzes volume and price action using Volume Price Analysis and Wyckoff's Effort versus Result law to detect market strength and potential reversals.
Explore 11,183 indicators. Filter beyond the obvious.
Discover the tools that fit the way you trade.
11,183 tools to explore
An experimental trading indicator that analyzes volume and price action using Volume Price Analysis and Wyckoff's Effort versus Result law to detect market strength and potential reversals.
A trading indicator that detects market contraction phases, identifies major and minor patterns, and highlights potential expansion and markup zones through dynamic lines and levels.
A time-based trading indicator dividing the market day into three phases: Accumulation, Manipulation, and Distribution, helping traders understand institutional trading strategies.
A Wyckoff Springs indicator identifies potential bullish reversal patterns by detecting price dips below support levels followed by quick rebounds, signaling a possible buying opportunity.
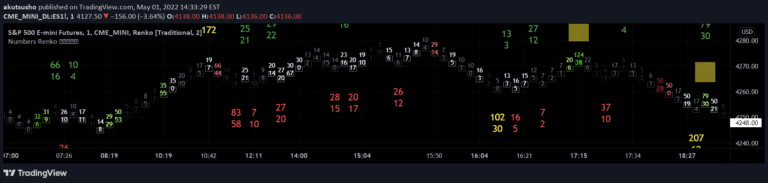
A Renko chart indicator that displays volume and time metrics within chart boxes, utilizing Wyckoff method principles to provide visual trading insights through color-coded numerical representations.
AMDX strategy divides the trading day into four distinct phases, providing a structured approach to understanding market behavior and institutional trading patterns.
A Wyckoff Method-based indicator using RSI to detect market accumulation and distribution phases, identifying key structural turning points in price movement.
Volume Spread Analysis indicator helps traders understand market intentions by analyzing volume and price movements through color-coded bars and predictive volume forecasting techniques.
A Wyckoff-based market phase indicator that detects key trading events using volume and price action to identify potential trend shifts and market structure changes.
A volume-price oscillator that analyzes market momentum and potential reversals by combining volume spread, price movement, and trend strength into a single indicator.
Auto Volume Spread Analysis indicator that interprets market intentions through volume and price movements, using advanced forecasting and pattern recognition techniques.
A volume and price spread analysis tool using normalization and Z-Score techniques to detect market trends, volume dynamics, and potential trading opportunities across different market conditions.
Likes, views, and comments are historical TradingView snapshots. They describe attention, not trading performance.