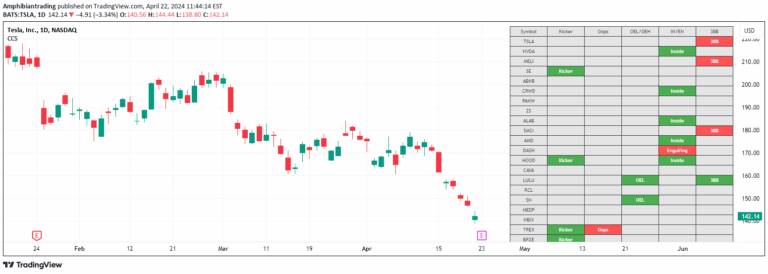
A 1-3-1 pattern detection strategy focusing on candle behavior and identifying potential trading setups through specific bar configurations.
Explore complementary indicator rolesHow it works
The 1-3-1 pattern detection strategy analyzes four consecutive candles with specific type configurations. It looks for an outside bar (Type 3) flanked by two inside bars (Type 1), with careful examination of the fourth candle's characteristics. The script checks whether the fourth candle remains an inside bar or becomes a directional bar, which would halt further calculations.
When a valid pattern is detected, the strategy plots a dotted line at the 50% level of the third candle. This allows traders to visualize potential price levels and setup conditions. The method requires precise candle type identification and uses a systematic approach to filter and highlight specific price action configurations.
Why it may be useful
The 1-3-1 pattern provides traders with a structured method to identify potential trading opportunities based on specific candle configurations. By recognizing precise bar interactions, traders can develop more disciplined entry and exit strategies that are grounded in objective price action analysis.
This approach reduces emotional decision-making by providing clear, predefined criteria for pattern recognition. It offers a systematic framework for understanding market dynamics, helping traders interpret subtle shifts in momentum and potential trend reversals through careful observation of consecutive candle behaviors.
When to explore it
The 1-3-1 pattern strategy is most effective on 12-hour charts where longer timeframe candle interactions can be more reliably analyzed. Traders should apply this method in markets with moderate volatility, where clear price action patterns are more likely to emerge and provide meaningful signals.
It works best when combined with additional confirmation indicators or volume analysis. Traders should be cautious and wait for complete pattern formation before making trading decisions, understanding that not all detected patterns will result in successful trades. Consistent application and thorough understanding of the method are key to leveraging its potential.
Keep exploring
What we’ve verified
Access, alerts and repainting behaviour have not been independently verified for this indicator. Check the creator’s current publication and settings.
General descriptions and classifications are recovered research. Verified details above identify the specific checks we have completed. Check the creator’s current publication for later changes.