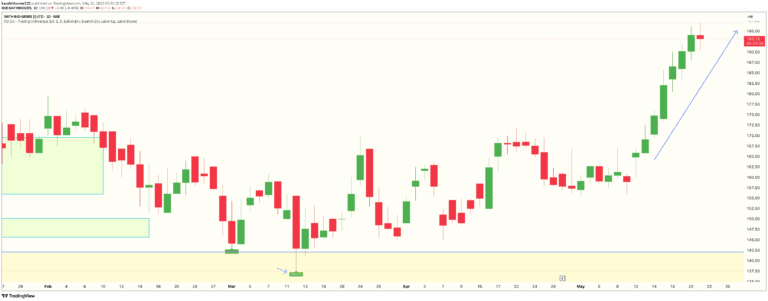
A screening tool that identifies specific candlestick combinations across multiple tickers, highlighting unique price action patterns and potential trend reversals.
Explore complementary indicator rolesHow it works
The Candle Combo Screener scans multiple ticker charts simultaneously to detect specific candlestick patterns like Bullish Kickers, Oops Reversals, and Inside Days. It works by comparing current candle characteristics against precise predefined criteria, such as comparing the current candle's open, close, high, and low prices with the previous day's candle.
Each pattern has unique detection rules. For instance, a Bullish Kicker requires the current candle to gap up above the prior day's candle body, with the previous day's close being lower than its open. Similarly, an Inside Day is detected when the current candle's high and low are completely contained within the prior day's price range.
Why it may be useful
Candlestick pattern recognition provides traders with quick visual insights into potential market sentiment and potential trend reversals. By identifying these patterns across multiple stocks simultaneously, traders can efficiently screen for trading opportunities and make more informed decisions about market behavior.
These patterns help traders understand underlying price dynamics, revealing potential shifts in market psychology. The ability to detect multiple pattern types in one view allows for comprehensive market analysis, reducing the time and effort required to manually scan different stock charts for meaningful price action signals.
When to explore it
The Candle Combo Screener is most effective during periods of market volatility and when traders want to quickly identify potential trend changes across multiple securities. It works best in markets with sufficient price movement and liquidity, where clear candlestick patterns can emerge and provide meaningful trading signals.
Traders should use this tool in conjunction with other technical and fundamental analysis methods to confirm potential trade setups. It is particularly useful for active traders who monitor multiple stocks simultaneously and need rapid, visual identification of potential trading opportunities across different market sectors.
Keep exploring
What we’ve verified
Access, alerts and repainting behaviour have not been independently verified for this indicator. Check the creator’s current publication and settings.
General descriptions and classifications are recovered research. Verified details above identify the specific checks we have completed. Check the creator’s current publication for later changes.