Ehlers Loops [BigBeluga]
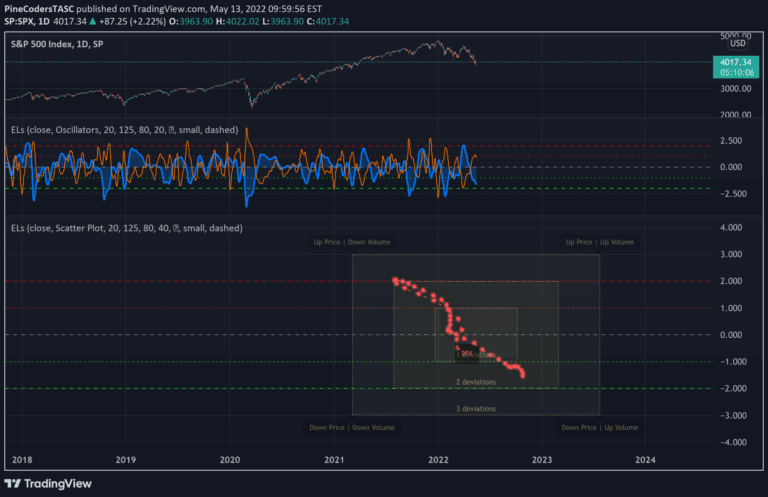
The Ehlers Loops indicator reveals price and volume dynamics through a quadrant-based visual representation, helping traders understand market momentum and potential trend reversals.
Explore 11,183 indicators. Filter beyond the obvious.
Discover the tools that fit the way you trade.
11,183 tools to explore
The Ehlers Loops indicator reveals price and volume dynamics through a quadrant-based visual representation, helping traders understand market momentum and potential trend reversals.
Ehlers Loops is an advanced visualization technique that compares filtered and scaled price and volume data to reveal potential market conditions and trading insights.
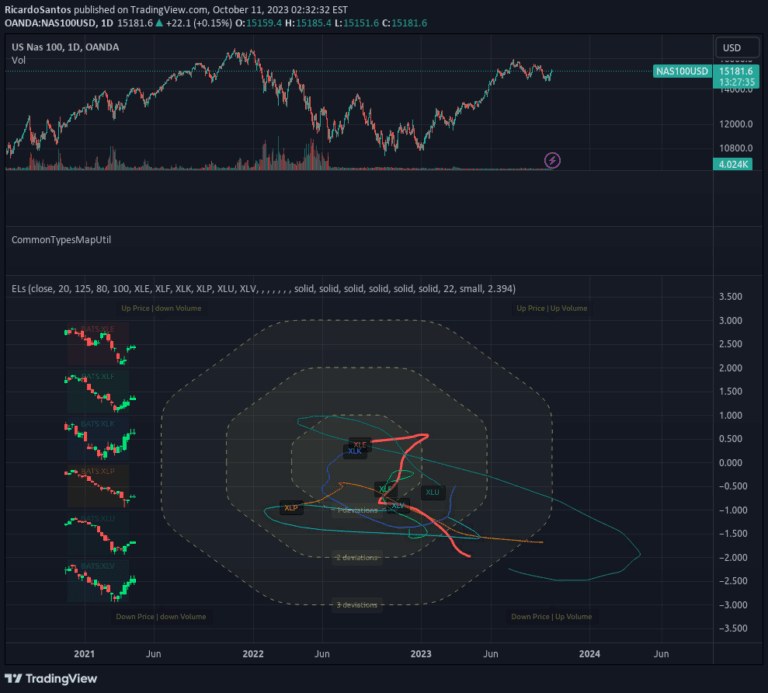
An expanded crocker graph visualization technique that tracks multiple tickers simultaneously, providing a comprehensive market overview with embedded commodity candle details.
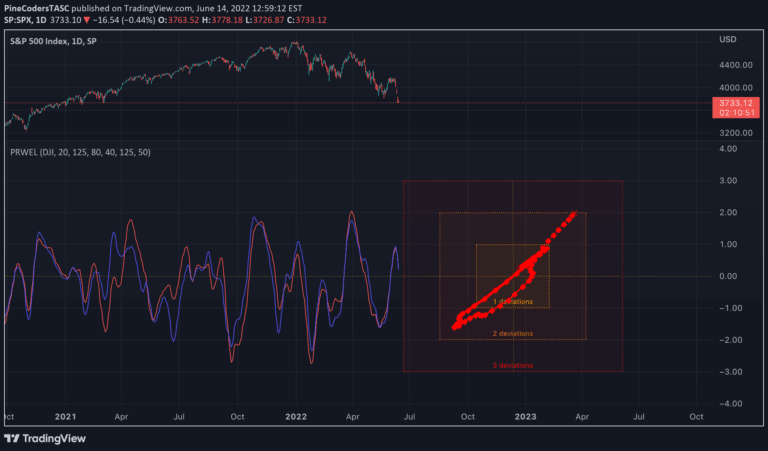
Ehlers Loops is a pairs rotation trading method that compares and analyzes the relative performance of two securities by filtering and scaling their price movements.
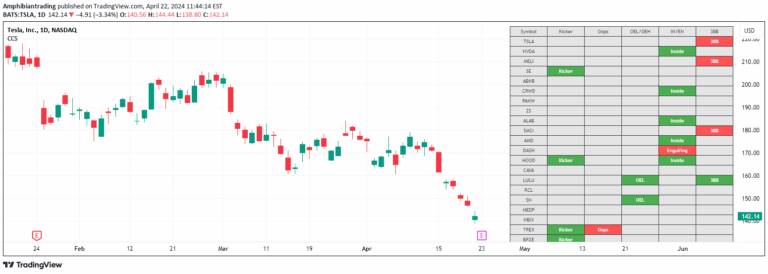
A screening tool that identifies specific candlestick combinations across multiple tickers, highlighting unique price action patterns and potential trend reversals.
A trading strategy based on identifying and trading quick price reversals after emotional market overreactions, using the previous day's high or low as key reference points.
Likes, views, and comments are historical TradingView snapshots. They describe attention, not trading performance.