A trading strategy based on identifying and trading quick price reversals after emotional market overreactions, using the previous day's high or low as key reference points.
Explore complementary indicator rolesHow it works
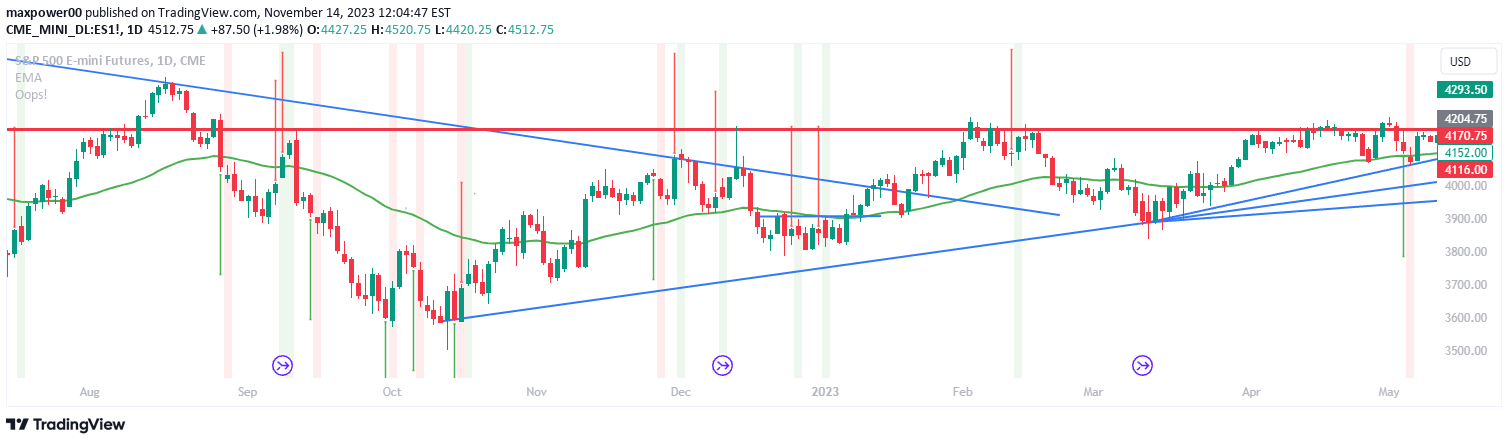
The Oops! signal identifies trading opportunities by monitoring extreme price movements relative to the previous day's price action. For a buy signal, traders look for an opening price below the previous day's low, followed by a rally back to that low level, indicating that selling pressure has diminished.
Conversely, for a sell signal, traders seek an opening price above the previous day's high, with subsequent price decline back to that high, suggesting potential downward momentum. The strategy capitalizes on market overreactions and quick sentiment shifts, providing a precise entry point based on price behavior.
Why it may be useful
The Oops! signal helps traders exploit market inefficiencies caused by emotional trading and overreactions. By identifying moments when initial extreme price movements are quickly reversed, traders can enter positions with potentially favorable risk-reward ratios.
This approach provides a structured method for trading short-term price anomalies, allowing traders to capitalize on market psychology and rapid sentiment changes. The signal offers a clear, rules-based entry strategy that can be applied across different markets and timeframes.
When to explore it
The Oops! signal works best in markets with moderate volatility and clear daily price ranges. It is particularly effective in liquid markets like major stock indices, forex pairs, and actively traded commodities where price movements are more predictable.
Traders should use this signal during regular trading hours when market volume is high and emotional trading behaviors are more pronounced. It is most suitable for short-term trading strategies focusing on quick, precise entries based on price action and market sentiment.
Keep exploring
What we’ve verified
Access, alerts and repainting behaviour have not been independently verified for this indicator. Check the creator’s current publication and settings.
General descriptions and classifications are recovered research. Verified details above identify the specific checks we have completed. Check the creator’s current publication for later changes.