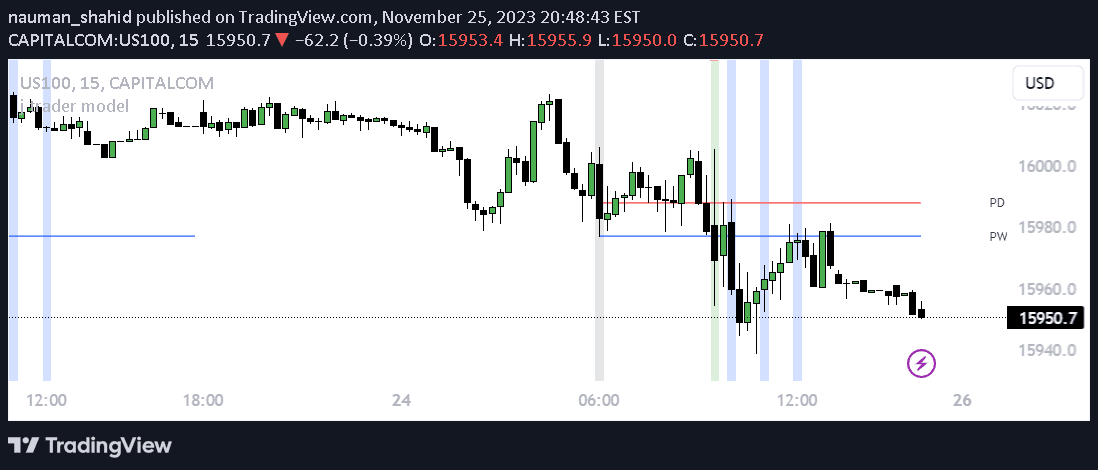
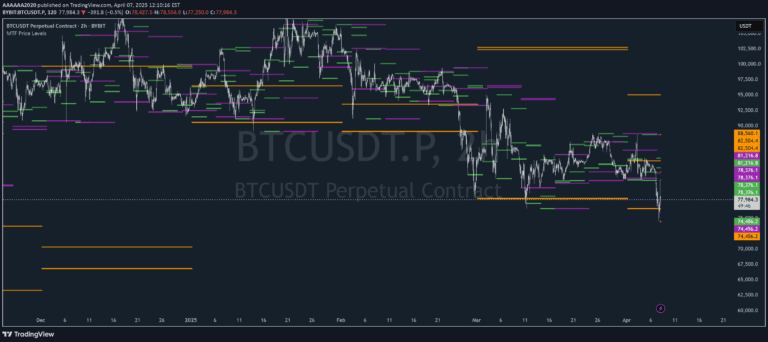
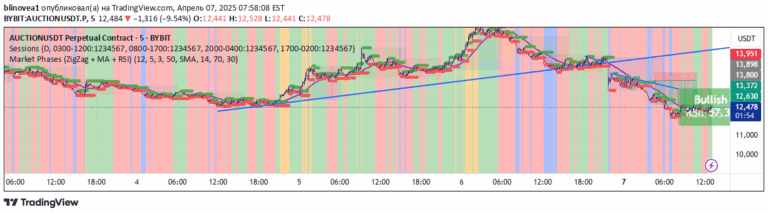
A trading approach focusing on higher timeframe OHLC analysis to understand market structure and potential directional movements using daily chart insights.
Explore complementary indicator rolesHow it works
Traders utilize higher timeframe Open, High, Low, Close (OHLC) data to interpret broader market structure and potential price movements. By observing daily candle formations and their relationships, traders can gain insights into market sentiment and potential directional bias.
The methodology involves analyzing daily chart patterns and using these insights to make more informed trading decisions on lower timeframe charts. Inspired by Inner Circle Trading (ICT) concepts, this approach emphasizes understanding the underlying market mechanics beyond simple price action.
Why it may be useful
Understanding higher timeframe OHLC provides traders with a more comprehensive view of market dynamics, helping them make more strategic trading decisions. By connecting multiple timeframe perspectives, traders can reduce noise and focus on more significant market movements.
This approach allows traders to align their trades with the broader market trend, potentially improving entry and exit timing. By incorporating higher timeframe analysis, traders can develop a more nuanced understanding of market structure and reduce the likelihood of trading against the dominant market direction.
When to explore it
This approach is most effective during periods of clear market trends and when there's sufficient volatility to create meaningful daily candle formations. Traders should focus on liquid markets with consistent volume and clear directional movements.
The strategy works best when combined with other technical analysis tools and when traders have a solid understanding of market structure. It is particularly useful for traders looking to develop a more holistic approach to market analysis beyond simple price action.
Keep exploring
What we’ve verified
Access, alerts and repainting behaviour have not been independently verified for this indicator. Check the creator’s current publication and settings.
General descriptions and classifications are recovered research. Verified details above identify the specific checks we have completed. Check the creator’s current publication for later changes.