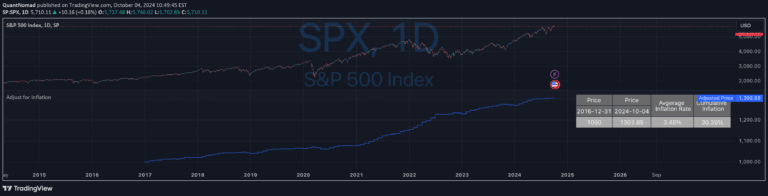
A TradingView script that adjusts Bitcoin's price for inflation, revealing its true purchasing power and value over time by comparing nominal and inflation-adjusted prices.
Explore complementary indicator rolesHow it works
The script tracks Bitcoin's price from 2009 onwards and calculates cumulative inflation rates to adjust its nominal value. It generates two primary lines on the chart: the original unadjusted Bitcoin price and a corresponding inflation-adjusted purchasing power line.
By comparing these lines, traders can see how Bitcoin's real value has changed over time, accounting for the eroding effects of inflation. The script essentially translates Bitcoin's price into consistent purchasing power terms, allowing for a more nuanced understanding of its economic performance beyond raw dollar amounts.
Why it may be useful
Understanding Bitcoin's value through an inflation-adjusted lens provides crucial insights for long-term investors and traders seeking a deeper market perspective. This approach helps reveal Bitcoin's potential as a store of value by demonstrating how its purchasing power has evolved independent of nominal price movements.
By showing Bitcoin's real economic performance, investors can make more informed decisions about its long-term viability and potential as an investment vehicle. The script offers a sophisticated way to evaluate Bitcoin's performance that goes beyond simple price tracking.
When to explore it
This signal is most effective for long-term investors and strategic traders interested in understanding Bitcoin's fundamental value trajectory. It works best when analyzing extended time periods, typically spanning multiple years to capture meaningful inflation adjustments.
Traders should utilize this signal when conducting comprehensive market analysis, evaluating Bitcoin's performance relative to traditional currencies, or assessing its potential as a hedge against inflationary pressures. It is particularly useful for investors seeking a more nuanced understanding of cryptocurrency valuation beyond surface-level price charts.
Keep exploring
What we’ve verified
Access, alerts and repainting behaviour have not been independently verified for this indicator. Check the creator’s current publication and settings.
General descriptions and classifications are recovered research. Verified details above identify the specific checks we have completed. Check the creator’s current publication for later changes.