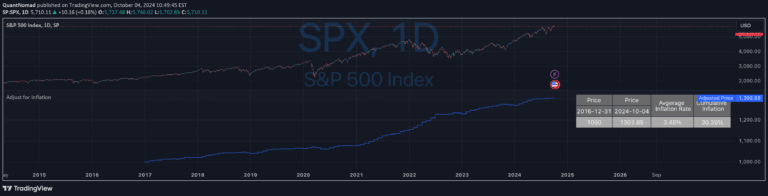
An inflation-adjusted chart revealing the true purchasing power of an asset by comparing nominal price against inflation-corrected value over time.
Explore complementary indicator rolesHow it works
The inflation-adjusted chart operates by taking the nominal market price of an asset and recalibrating it against a standardized inflation index. This process involves selecting a base year or inception point and adjusting subsequent prices to reflect the changing purchasing power of currency over time.
By applying an inflation adjustment mechanism, the chart transforms raw price data into a more meaningful representation of real value. The technique allows investors to see beyond surface-level price movements and understand the genuine economic performance of an asset across different time periods.
Why it may be useful
Inflation-adjusted charts provide critical insights into an asset's true economic performance by revealing whether investment gains are genuine or merely nominal. They help investors distinguish between real wealth creation and the illusive appearance of growth driven by inflationary pressures.
By comparing nominal and inflation-adjusted prices, traders can make more informed decisions about long-term investment strategies. This approach enables a deeper understanding of an asset's actual value preservation and growth potential, beyond simplistic price tracking.
When to explore it
Inflation-adjusted charts are most valuable when analyzing long-term investment performance across extended time horizons. They are particularly useful for comparing assets across different economic periods, helping investors understand relative value and real returns.
These charts become especially critical during periods of significant economic change, such as times of high inflation, monetary policy shifts, or when evaluating historical investment performance. They provide a nuanced perspective that goes beyond surface-level price movements, offering a more comprehensive view of economic value.
Keep exploring
What we’ve verified
Access, alerts and repainting behaviour have not been independently verified for this indicator. Check the creator’s current publication and settings.
General descriptions and classifications are recovered research. Verified details above identify the specific checks we have completed. Check the creator’s current publication for later changes.