TASC 2025.01 Linear Predictive Filters
A sophisticated signal processing technique that identifies dominant market cycles by applying linear predictive filters to price data, helping traders adapt strategies to changing market conditions.
Explore 11,183 indicators. Filter beyond the obvious.
Discover the tools that fit the way you trade.
11,183 tools to explore
A sophisticated signal processing technique that identifies dominant market cycles by applying linear predictive filters to price data, helping traders adapt strategies to changing market conditions.
A sophisticated directional movement indicator using Hann windowing to analyze market trends. It enhances traditional Directional Movement Index (DMI) calculations through advanced smoothing techniques.
Analyst Table provides comprehensive visual representation of analyst estimates and recommendations, displaying price targets and sentiment directly on the trading chart for quick market insights.
The Moving Average Difference with Hann Windowing is an advanced oscillator that uses Hann-filtered moving averages to create a smooth trend indicator with adaptive cycle detection.
Mswing is a momentum oscillator measuring price change over 20 and 50 periods, helping traders assess market momentum, relative strength, and potential entry/exit points across different timeframes.
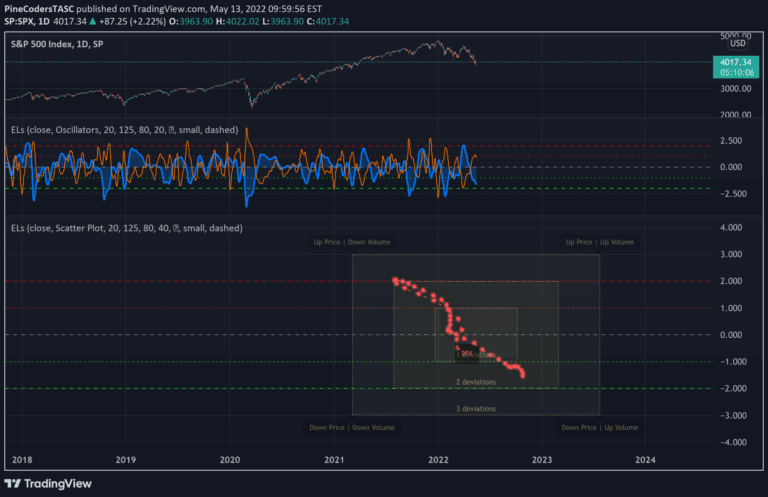
Ehlers Loops is an advanced visualization technique that compares filtered and scaled price and volume data to reveal potential market conditions and trading insights.
A zero-lag indicator developed by John F. Ehlers combining Reflex and Trendflex components to reduce signal lag and provide more sensitive trend and cycle analysis.
An advanced market analysis indicator using autocorrelation to identify cyclical patterns, trends, and potential reversals by examining the correlation of price data across different time lags.
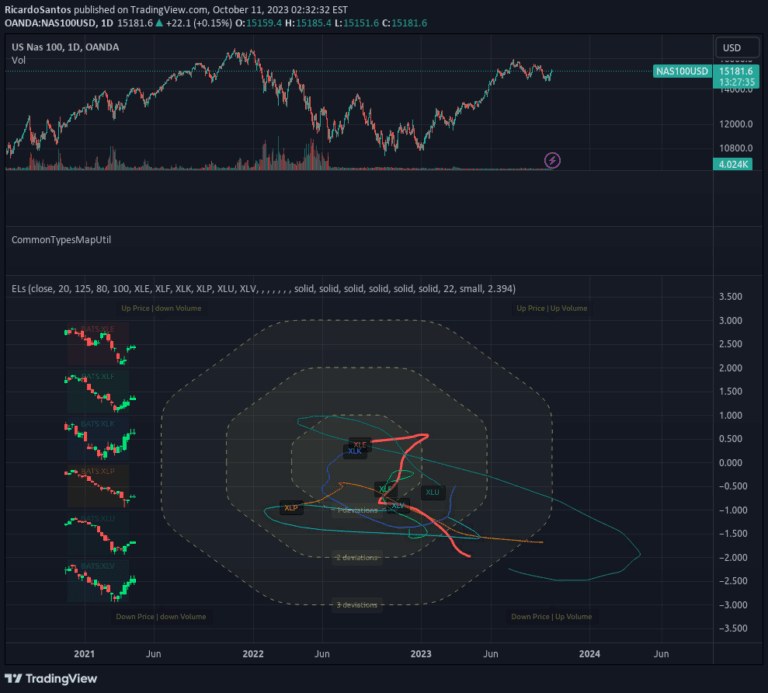
An expanded crocker graph visualization technique that tracks multiple tickers simultaneously, providing a comprehensive market overview with embedded commodity candle details.
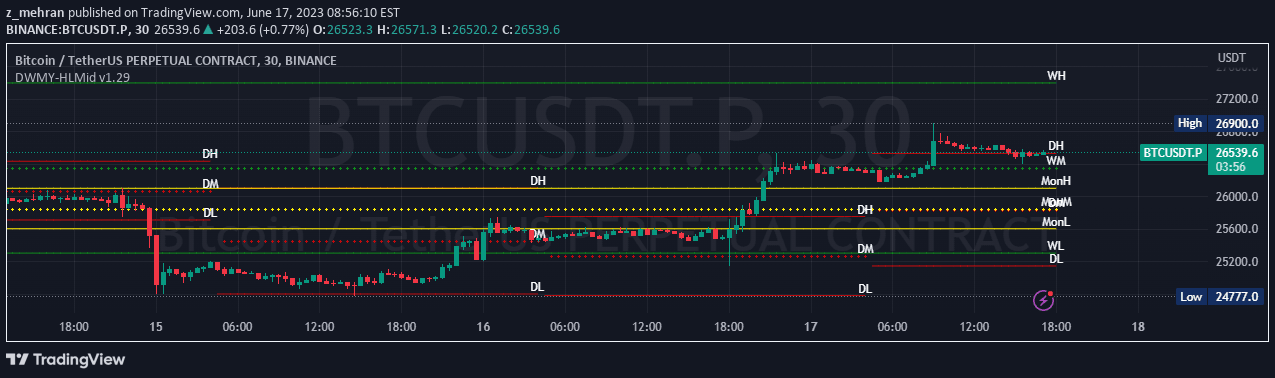
A comprehensive price level indicator that tracks daily, weekly, monthly, quarterly, and yearly high, mid, and low values to help traders analyze market movements and identify key support and resistance levels.
A sophisticated oscillator by John F. Ehlers that uses two-pole highpass and lowpass filters to create a flexible, normalized indicator that captures specific market cycle frequencies.
A powerful trading indicator combining Volume Profile and Order Block analysis to identify high-liquidity zones and potential trend reversals with customizable features.
Likes, views, and comments are historical TradingView snapshots. They describe attention, not trading performance.