
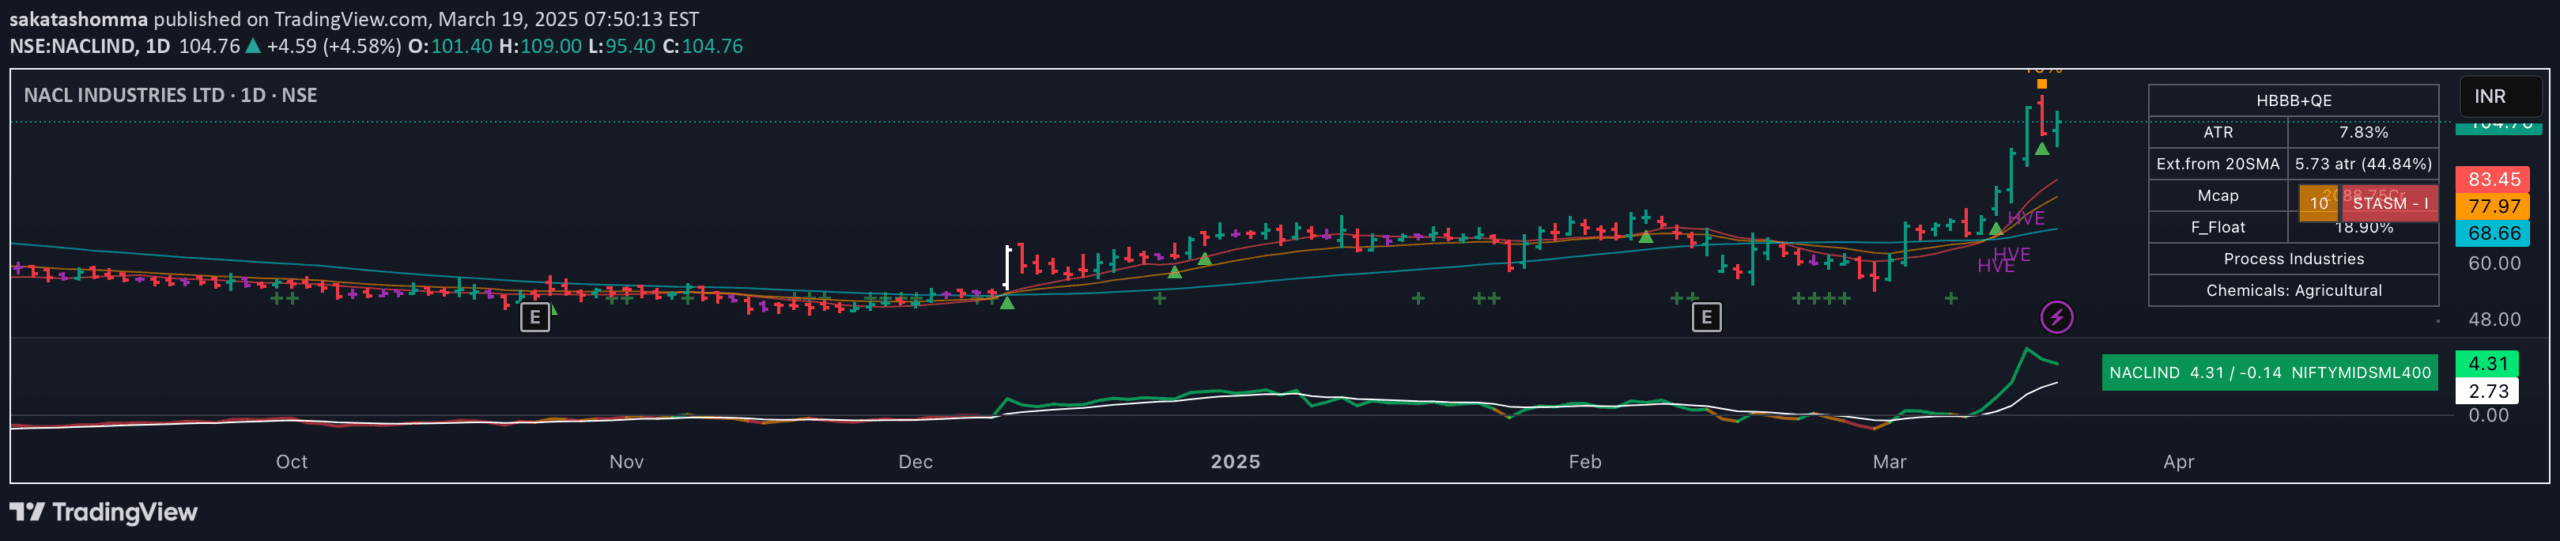
Mswing is a momentum oscillator measuring price change over 20 and 50 periods, helping traders assess market momentum, relative strength, and potential entry/exit points across different timeframes.
Explore complementary indicator rolesHow it works
The Mswing calculates momentum by tracking price changes over 20 and 50 periods, creating an oscillator that fluctuates above and below zero. Traders compare the Mswing to its exponential moving average (EMA) to understand momentum dynamics.
When Mswing is positive and above EMA, momentum is accelerating, suggesting potential buying opportunities. Conversely, when Mswing is negative and below EMA, momentum is weakening, signaling potential exit points. The indicator uses different EMAs like 5 or 9 periods to provide nuanced momentum analysis
Why it may be useful
Mswing provides traders with a comprehensive momentum assessment tool that goes beyond simple price movement analysis. By quantifying momentum strength, traders can make more informed decisions about market entry and exit points.
The indicator helps identify trend acceleration, deceleration, and potential reversals across different market conditions. It allows for comparative analysis between stocks, sectors, and indices, enabling more strategic capital allocation. Mswing's multi-timeframe approach provides insights from daily swing trades to long-term portfolio adjustments
When to explore it
Mswing works best during trending markets with clear directional movements. It is particularly effective for swing traders looking to capture multi-day price moves. Traders should use Mswing in conjunction with other technical indicators like moving averages for confirmation.
The indicator is most reliable when analyzing stocks with consistent momentum and during periods of sectoral rotation. Ideal for traders seeking to understand relative strength and momentum across different timeframes, from daily to monthly charts
Keep exploring
What we’ve verified
Access, alerts and repainting behaviour have not been independently verified for this indicator. Check the creator’s current publication and settings.
General descriptions and classifications are recovered research. Verified details above identify the specific checks we have completed. Check the creator’s current publication for later changes.


