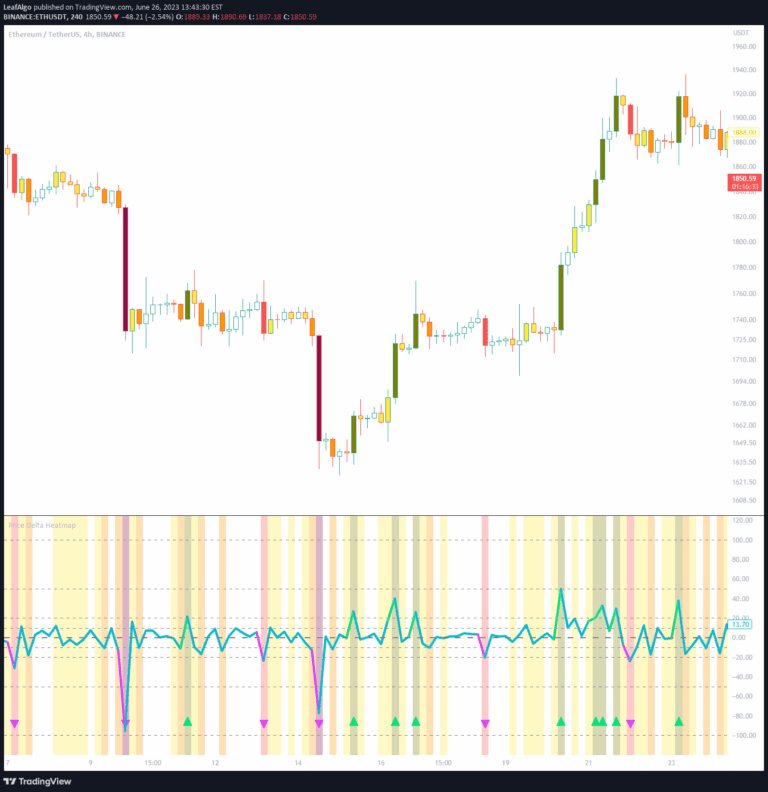
A multi-timeframe heatmap indicator that visualizes price movement relative to average ranges, helping traders assess momentum, volatility, and potential reversals across different timeframes.
Explore complementary indicator rolesHow it works
The MTF RZP Heatmap calculates average price ranges for multiple timeframes by measuring the high-to-low movement over a specified number of periods. It then creates a dynamic baseline range for each timeframe, which serves as a reference point for current price action.
For each timeframe, the indicator measures how far the current price has moved from the period's opening price and converts this movement into a percentage between -100% and +100%. This percentage is then visualized through color-coded vertical heatmaps, with colors ranging from bearish to bullish, allowing traders to quickly understand price momentum.
Why it may be useful
This indicator provides traders with a comprehensive view of price movement across different timeframes, helping them make more informed trading decisions. By visualizing momentum and range expansion, traders can identify potential trend strength, overextended price moves, and possible reversal points.
The multi-timeframe approach allows traders to align their analysis across various time horizons, reducing the risk of trading against the broader market trend. By comparing price action and momentum across different timeframes, traders can gain deeper insights into market dynamics and potential trading opportunities.
When to explore it
The MTF RZP Heatmap is most effective when traders want to analyze price momentum and volatility across multiple timeframes simultaneously. It works best in trending markets where price movements show clear directional momentum and when traders are looking to confirm trend strength or identify potential reversal points.
Traders should use this indicator in conjunction with other technical analysis tools to validate signals and improve trade accuracy. It is particularly useful for identifying divergences between timeframes, assessing market volatility, and timing entries and exits based on range and momentum analysis.
Keep exploring
What we’ve verified
Access, alerts and repainting behaviour have not been independently verified for this indicator. Check the creator’s current publication and settings.
General descriptions and classifications are recovered research. Verified details above identify the specific checks we have completed. Check the creator’s current publication for later changes.