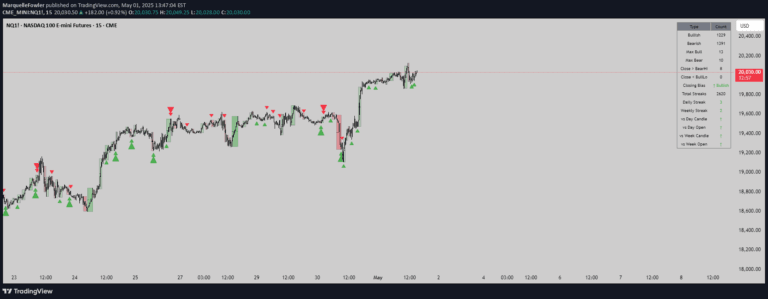
1R Breakout identifies bars that exceed the previous bar's range by more than 1R, highlighting significant price movements and potential trend continuation or reversal signals.
Explore complementary indicator rolesHow it works
The 1R Breakout indicator systematically analyzes each price bar to detect significant range expansions beyond the previous bar. It specifically looks for bars that break out more than one risk unit (1R) larger than the preceding bar's range. This method provides a quantitative approach to identifying potential momentum shifts and meaningful price movements.
By measuring and highlighting these substantial range expansions, traders can quickly identify bars that represent more significant market activity. The indicator essentially acts as a visual filter, drawing attention to bars that demonstrate a notable increase in price movement compared to the immediate preceding price action.
Why it may be useful
The 1R Breakout indicator helps traders quickly identify potential trend acceleration or meaningful price movements that might signal important market shifts. By quantifying range expansion, it provides a systematic way to detect when price is moving with increased momentum and potentially breaking out of previous trading ranges.
This can help traders recognize emerging opportunities more objectively. Moreover, the indicator reduces subjective interpretation by providing a clear, mathematical definition of what constitutes a significant price movement. Traders can use this signal to confirm trend strength, spot potential entry points, and make more informed trading decisions based on concrete price action metrics.
When to explore it
The 1R Breakout is most effective in markets with clear directional movements and during periods of increased volatility. It works particularly well in markets like futures, forex, and actively traded stocks where price can make rapid, significant moves. Traders should pay special attention to this signal during key economic announcements, earnings reports, or other events that might trigger substantial price changes.
The indicator is especially useful for traders seeking to catch early momentum shifts and identify potential trend continuation or reversal points. It is most reliable when used in conjunction with other technical indicators and fundamental analysis to confirm the signal's validity and reduce false positive readings.
Keep exploring
What we’ve verified
Access, alerts and repainting behaviour have not been independently verified for this indicator. Check the creator’s current publication and settings.
General descriptions and classifications are recovered research. Verified details above identify the specific checks we have completed. Check the creator’s current publication for later changes.