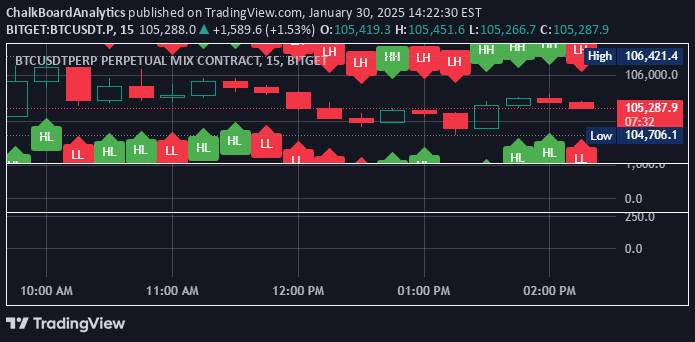
A price action indicator that identifies swing high and low breakouts, providing visual signals to help traders spot potential trend entry points across different markets.
Explore complementary indicator rolesHow it works
The indicator uses a configurable lookback period to detect swing highs and lows by comparing a candle's high or low with surrounding candles. When a swing high is identified, a green dashed line is drawn at that level, extending 15 candles for visual reference.
For breakout signals, a green triangle below the candle indicates a potential buy opportunity when price breaks above a swing high, while a red triangle above the candle signals a potential sell opportunity when price breaks below a swing low. Each swing level triggers only one breakout signal to maintain chart clarity.
Why it may be useful
This indicator helps traders identify key price action levels and potential trend continuation or reversal points without complex calculations. By highlighting swing highs and lows, it provides a visual framework for understanding market structure and momentum.
The simplicity of the breakout signals allows traders to quickly assess potential entry points and make more informed trading decisions. It transforms abstract price movements into clear, actionable visual cues that can be easily integrated with other technical analysis tools.
When to explore it
The indicator works best on higher timeframes like 1-hour and 4-hour charts in trending markets, where price action is more defined and reliable. It is particularly effective in identifying potential trend entry points after clear directional moves.
Traders should combine this tool with other technical indicators like moving averages or support/resistance levels to filter and confirm signals. It is less effective in sideways or choppy market conditions where breakouts are more likely to generate false signals.
Keep exploring
What we’ve verified
Access, alerts and repainting behaviour have not been independently verified for this indicator. Check the creator’s current publication and settings.
General descriptions and classifications are recovered research. Verified details above identify the specific checks we have completed. Check the creator’s current publication for later changes.