
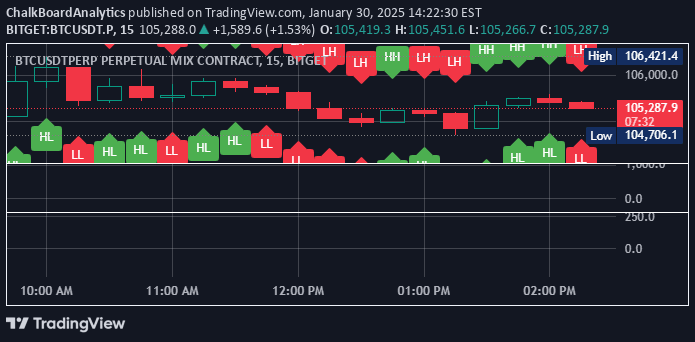
A TradingView script that labels chart bars with color-coded indicators identifying higher and lower highs and lows to help traders track price action and trend direction.
Explore complementary indicator rolesHow it works
The script automatically analyzes each price bar and compares it to surrounding bars to determine its relative position in the price structure. Green labels are applied to bars representing higher highs (HH) and higher lows (HL), indicating potential upward momentum and trend strength.
Red labels are used for bars showing lower highs (LH) and lower lows (LL), signaling potential downward price movement or trend weakness. This visual labeling system provides traders with an immediate, intuitive understanding of price action dynamics across different timeframes and markets.
Why it may be useful
By providing instant visual cues about price structure, this script helps traders quickly identify trend characteristics and potential directional changes. The color-coded labels make it easier to recognize key market phases, allowing traders to make more informed decisions about entry and exit points.
The script's versatility across different timeframes and markets means traders can apply this analysis technique to various trading instruments, enhancing their ability to interpret price action patterns and understand market psychology without complex calculations.
When to explore it
This signal is most effective when traders want to quickly assess market trends and price structure across different timeframes. It works particularly well in markets with clear directional movements, such as forex, stocks, and cryptocurrencies during trending periods.
Traders should use this tool in conjunction with other technical analysis methods to confirm signals and reduce false interpretations. It is especially useful for identifying potential trend reversals, momentum shifts, and understanding the underlying market structure.
Keep exploring
What we’ve verified
Access, alerts and repainting behaviour have not been independently verified for this indicator. Check the creator’s current publication and settings.
General descriptions and classifications are recovered research. Verified details above identify the specific checks we have completed. Check the creator’s current publication for later changes.


