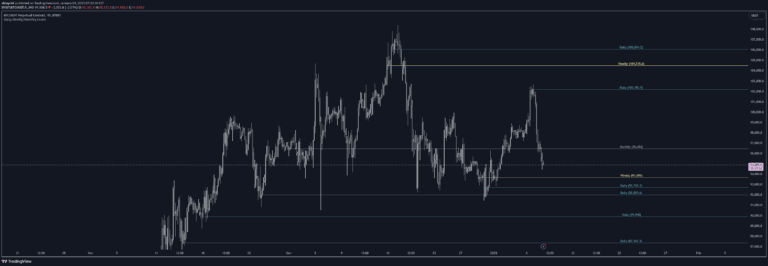
A technical analysis tool tracking key price levels and patterns during a specific UK trading session, highlighting liquidity zones, reference points, and potential price action signals.
Explore complementary indicator rolesHow it works
The indicator operates within a specific trading session starting at 12:00 PM UK time, dynamically tracking Buy Side Liquidity (BSL) and Sell Side Liquidity (SSL) levels between 12:00 PM and 2:00 PM. These lines extend horizontally until 3:30 PM, capturing the highest high and lowest low during this window, and then freeze at their final levels.
The tool also highlights the 2:30 PM candle and identifies Engulfing Fair Value Gaps (FVGs), which represent significant price gaps created by engulfing candles. By marking these key levels and patterns, the indicator provides traders with visual markers for potential support, resistance, and liquidity zones within the trading session.
Why it may be useful
This indicator helps traders visualize critical price levels and liquidity zones during a specific trading window, offering insights into potential market dynamics and price action. By tracking the highest and lowest prices within a defined timeframe, it provides a structured approach to understanding intraday market movements and identifying potential trading opportunities.
The tool's ability to highlight key reference points like the 12 PM line, BSL/SSL levels, and specific candles allows traders to make more informed decisions. It helps in identifying potential support and resistance zones, understanding market imbalances, and recognizing possible entry or exit points based on price action and liquidity.
When to explore it
The indicator is most effective for intraday traders focusing on short-term price movements, particularly those trading during the UK market session. It works best on 1-minute or 5-minute charts, providing visual aids for analyzing price action and liquidity within a specific timeframe. Traders can use this tool to identify potential trade setups, support and resistance levels, and market sentiment.
It is particularly useful for traders who want to understand the market's structure during a specific session, track liquidity zones, and identify potential reversal or continuation patterns. The indicator is most valuable for those trading forex, indices, or other markets with significant UK session activity, offering a structured approach to intraday technical analysis.
Keep exploring
What we’ve verified
Access, alerts and repainting behaviour have not been independently verified for this indicator. Check the creator’s current publication and settings.
General descriptions and classifications are recovered research. Verified details above identify the specific checks we have completed. Check the creator’s current publication for later changes.