
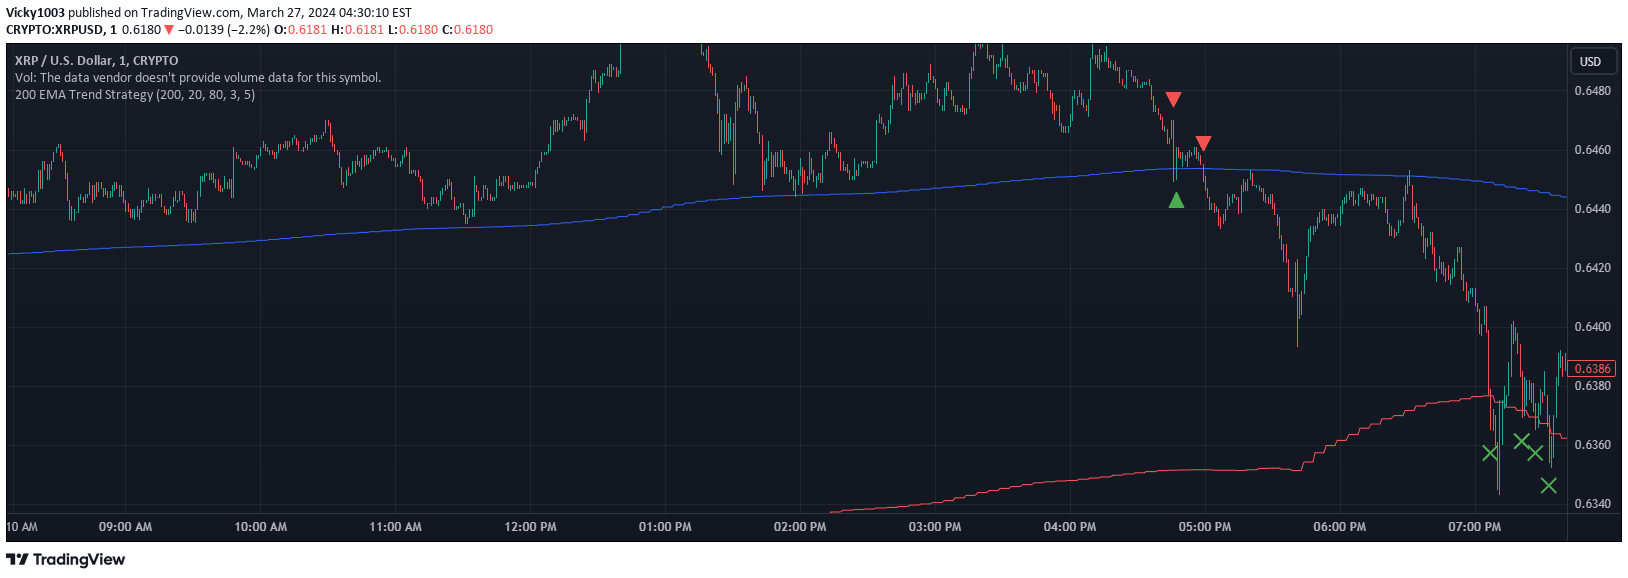
A technical analysis strategy using the 200-period Exponential Moving Average to identify trend reversals and potential entry and exit points across different timeframes.
Explore complementary indicator rolesHow it works
The 200 EMA Trend Strategy operates by plotting a 200-period Exponential Moving Average on a price chart and calculating standard deviation bands around this moving average. When the price crosses above the 200 EMA, it generates a buy signal, indicating a potential bullish trend, while a cross below the EMA triggers a sell signal suggesting a bearish trend.
The strategy also incorporates standard deviation bands to help identify overbought and oversold levels. Exit signals are triggered when the price moves beyond these bands in the opposite direction of the current trend, allowing traders to minimize potential losses and manage risk effectively.
Why it may be useful
The 200 EMA Trend Strategy provides traders with a clear, objective method for identifying market trends and potential trading opportunities across different timeframes. By using a longer-period moving average, the strategy helps filter out short-term market noise and focus on more significant price movements.
This approach offers traders a systematic way to understand market direction, manage risk, and make more informed trading decisions. The combination of trend analysis and standard deviation bands provides a comprehensive view of market dynamics, helping traders to develop a more disciplined and structured trading approach.
When to explore it
The 200 EMA Trend Strategy is most effective in markets with clear trending characteristics, where prices are moving in a consistent direction over time. It works particularly well in liquid markets with sufficient price movement, such as major stock indices, forex pairs, and highly traded commodities.
Traders can adapt the strategy to different timeframes, from one-minute charts for day trading to four-hour charts for longer-term investing. The flexibility of the strategy allows traders to customize it to their specific trading style, risk tolerance, and market conditions.
Keep exploring
What we’ve verified
Access, alerts and repainting behaviour have not been independently verified for this indicator. Check the creator’s current publication and settings.
General descriptions and classifications are recovered research. Verified details above identify the specific checks we have completed. Check the creator’s current publication for later changes.


